
Fig. 4.
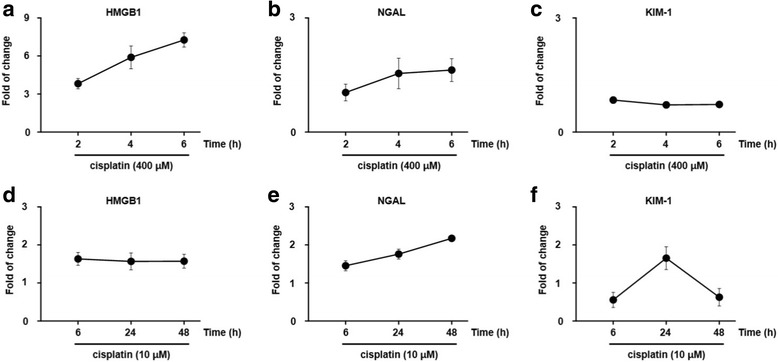
Fold-change of kidney injury biomarkers after high- and low-dose cisplatin treatment. HMGB1 (a), NGAL (b) and KIM-1 (c) levels are shown for cells treated with 400 μM cisplatin for a short exposure time (2 to 6 h). HMGB (d), NGAL (e) and KIM-1 (f) levels were measured in cells treated with 10 μM cisplatin and a longer exposure time (6 to 48 h). The data were compared with the control condition