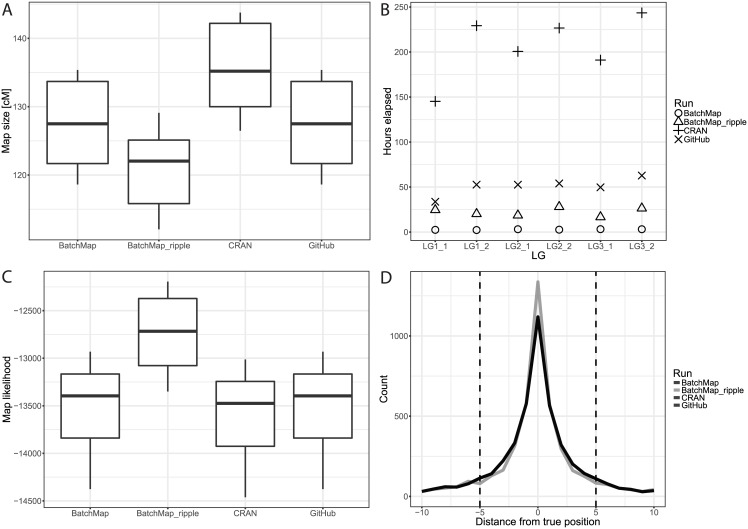
Fig 2. Summary statistics of all evaluation runs for OneMap and BatchMap.
In order to control for random effects during ordering and grouping, those factors were estimated once using RECORD and supplied to all runs. A) Boxplots (N = 6) of linkage map sizes in centiMorgans for all evaluations. B) Hours elapsed per calculation for each pseudo-testcross of three linkage groups between 724 and 794 markers in density. C) Boxplots (N = 6) of linkage map likelihoods for all evaluations. D) Frequency polygons for all evaluations summarizing the distance of each marker to its true position. All versions except BatchMap_ripple are identical and hence overlap. BatchMap_ripple was run with a window size of five, which is indicated by the vertical dashed bars.

