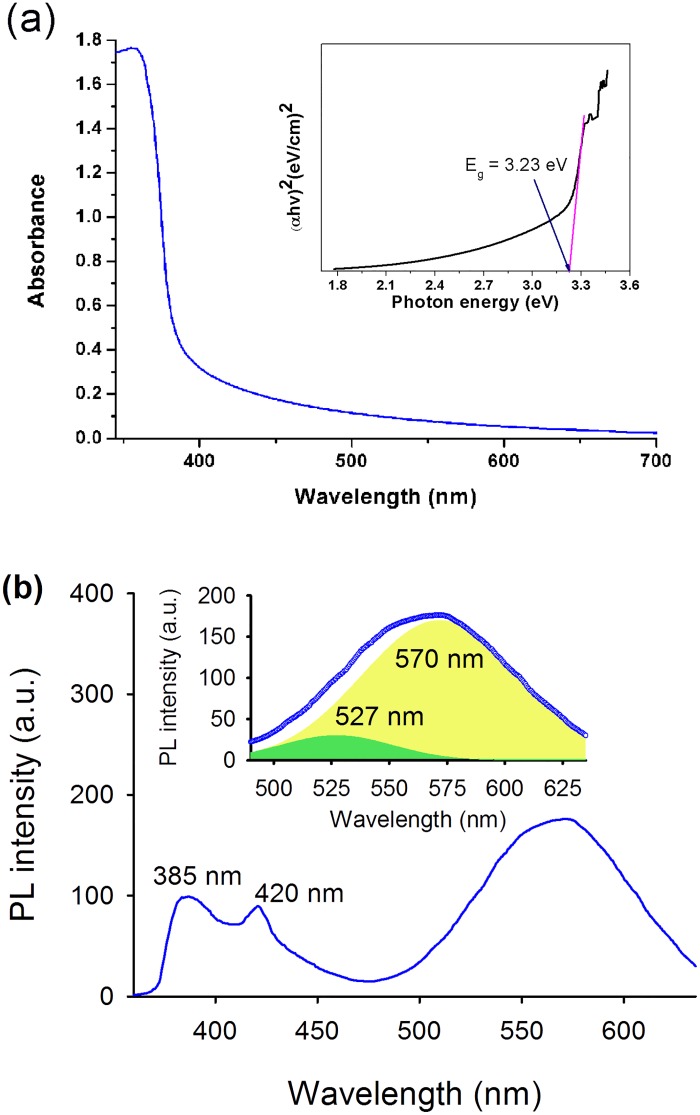
Fig 4. (a) Typical optical absorption spectrum and (b) room temperature photoluminescence (PL) spectrum of ZnO nanorods.
Inset in Fig 4a representing the tauc plot and inset in Fig 4b is showing the ZnO surface defect mediated PL bands (excitation: 325 nm) deconvoluted into two Gaussian components centered at 527 nm and 570 nm, respectively.

