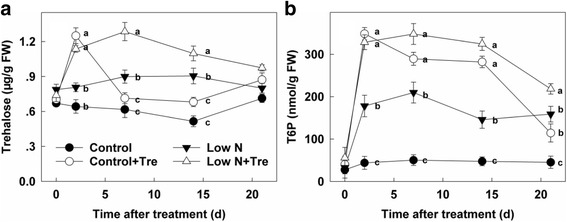
Fig. 2.

The contents of trehalose (a) and T6P (b) in the youngest fully expanded leaf after different treatment for 0, 2, 7, 14 and 21 days as indicated. Values represent the mean ± SE of 5 individual plants. Within each set of experiments, the different letters indicate significant differences (P < 0.05)
