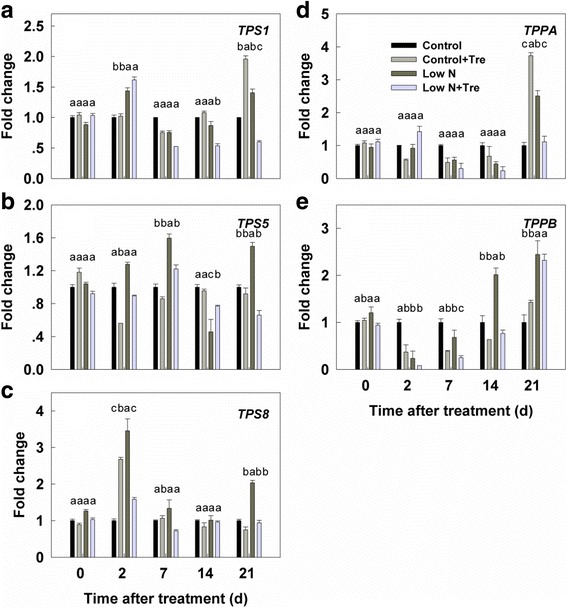
Fig. 7.

Relative expression of trehalose phosphate synthase genes (a, b and c) and trehalose phosphate phosphatase genes (d and e) in the youngest fully expanded leaf determined by qRT-PCR in response to low nitrogen and exogenous trehalose. Values represent the mean ± SE of 5 individual plants. Within each set of experiments, the different letters indicate significant differences (P < 0.05)
