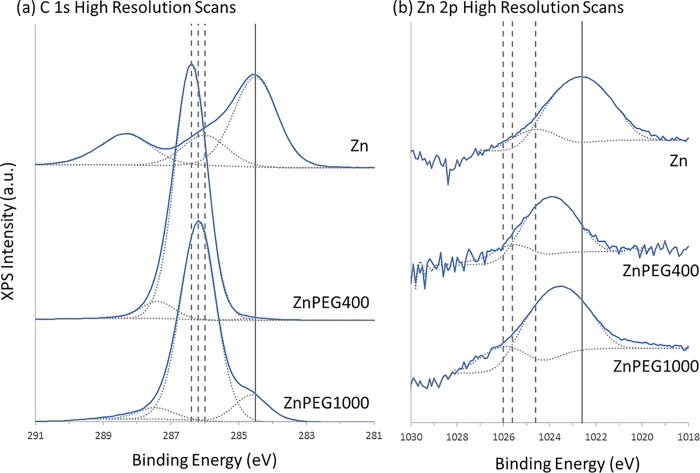
Fig 3. XPS spectra.
Representative high resolution XPS spectra showing the (a) C 1s and (b) Zn 2p3/2 core lines for the freshly prepared bare zinc and PEGylated zinc nanoparticles stored 1 day at 278 K (5 oC), with the spectra offset to facilitate viewing. The Zn 2p spectra are shown in log-scale. The solid curves indicate the experimentally obtained spectra, with the dotted curves underneath indicating their best-fit chemical components. For the C 1s spectra, from lower to higher binding energy, the components are C-C, C-O, and C = O. For the Zn 2p spectra, the components are Zn and ZnO. For the (a) C 1s plots, the solid vertical line represents the position of the C-C peaks, to which all spectra were calibrated to, with the dotted lines showing the spectral shift of the C-O peaks, which were 286 eV, 286.4 eV, and 286.2 eV for the Zn, ZnPEG400, and ZnPEG1000 systems, respectively. For (b) Zn 2p plots, the solid line represents the position of the Zn peak for the bare Zn system, while the dotted lines show the spectral shift of the ZnO peaks, which were 1024.6 eV, 1025.6 eV, and 1026.0 eV for the Zn, ZnPEG400, and ZnPEG1000 systems, respectively. Each spectrum represents an average of six spectral runs.

