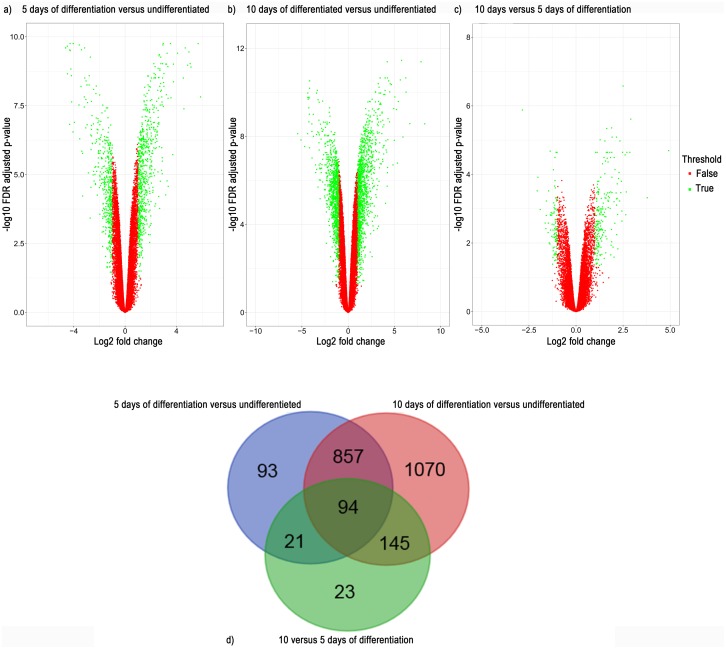
Fig 2. Volcano plot showing genes in and outside of cutoff values for differentially expressed genes (i.e. adjusted p-value ≤ 0.05 and absolute log2(fold change) >1).
Red dots represent genes outside of the cutoff values and green dots represents differentially expressed genes at a) 5 days of differentiation vs undifferentiated cells b) 10 days of differentiation vs undifferentiated cells c) 10 days vs 5 days of differentiation d) Venn diagram showing overlap of differentially expressed genes between the different time points.

