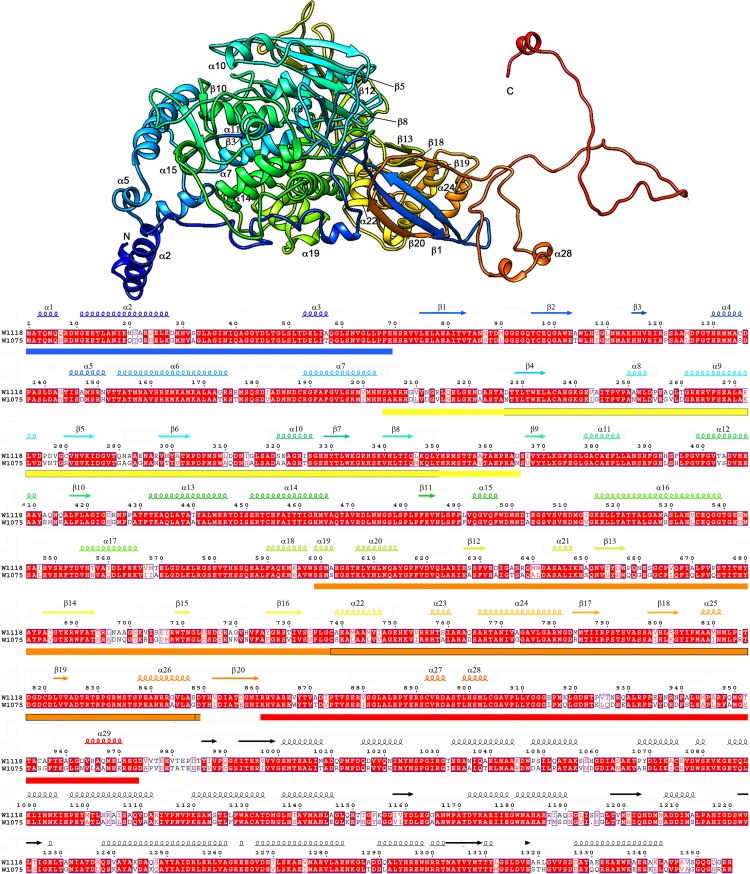
Fig 2. Atomic model of P2.
Top, ribbon diagram of the RnQV1 W1118 P2 capsid protein (side view), rainbow-colored from blue (N terminus) to red (C terminus). The N and C termini are indicated. Bottom, sequence and SSE analysis of the 1356-residue P2, rainbow-colored from blue (N terminus) to red (C terminus). The C-terminal 383-residue segment is not present; the consensus-predicted SSE for P2 (black) are shown. Colored boxes indicate insertions in the conserved domain (SID or P2*; defined in Fig 4) at the N terminus (blue), middle (yellow and orange) and C terminus (red). The boxed yellow region (segment 227–350) indicates the gelsolin-like fold; boxed orange region (segment 738–848) indicates the SIID. The aligned P2 sequences for W1118 and W1075 are shown.

