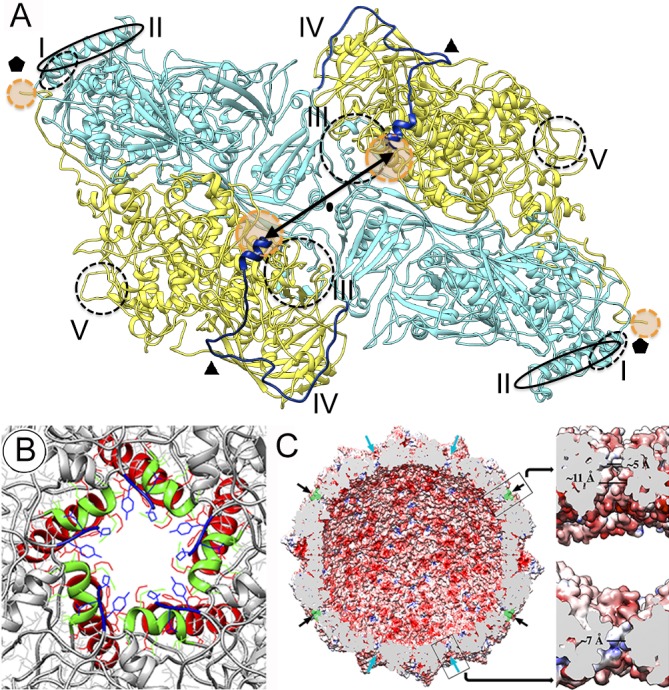
Fig 6. Molecular interaction and pore structure in the RnQV1 capsid.

(A) Intra- and intersubunit interactions between P2 (blue) and P4 (yellow) (top view). Two P2-P4 heterodimers related by a two-fold symmetry axis (oval) are shown. Type I-V molecular hooks are indicated; type II (continuous oval) and IV hooks (dark blue line) are located on the outer capsid surface, hooks I (dashed oval), III and V (dashed circles) on the capsid inner surface. Small orange circles near the five-fold axis indicate the flexible, invisible C-terminal region of P4; large orange circles near the two-fold axis indicate the cleaved C-terminal region of P2, whose last visible residues are separated by 45 Å (double arrow). (B) Pores at the five-fold axes (top view). P2 α2 (red) and α5 (green) helices and P4 Lys1005 (blue) are indicated. Residues that define the pore opening are modeled as stick; P2 Lys27 (red) and Arg150 (green) and P4 Tyr1003 and Lys1005 (blue). (C) RnQV1 capsid inner surface represented with electrostatic potential, showing negative (red) and positive (blue) charge distribution. Arrows indicate capsid pores at the five-fold (black) and three-fold (blue) axes. Plugs of density of P4 flexible regions (green) are shown occluding the five-fold pores. Boxes, magnified views of the five- (top) and three-fold (bottom) pores showing charge distribution on channel walls (slabbed side view). Opening sizes are indicated.
