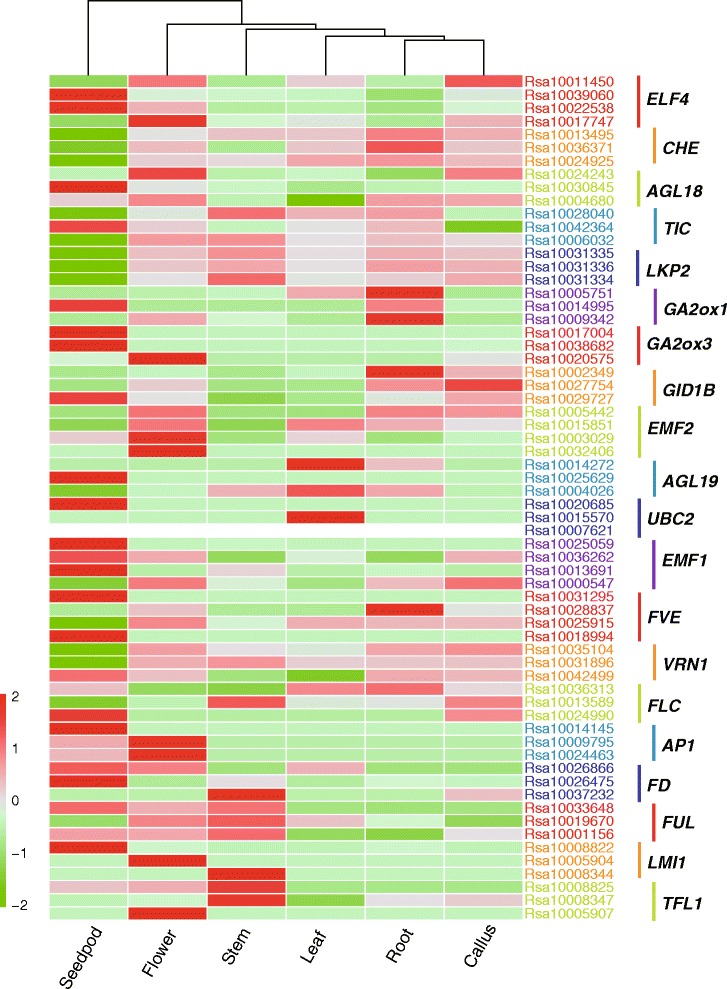
Fig. 5.

Heatmap of Raphanus sativus flowering gene expression profiles. The analyzed tissues are indicated at the bottom of each column. The R. sativus gene codes to the right of the expression bar in the same color are homologs of the corresponding genes indicated on the right side with a colored line. The color scale bar at the bottom left of the figure represents log2 transformed FPKM values
