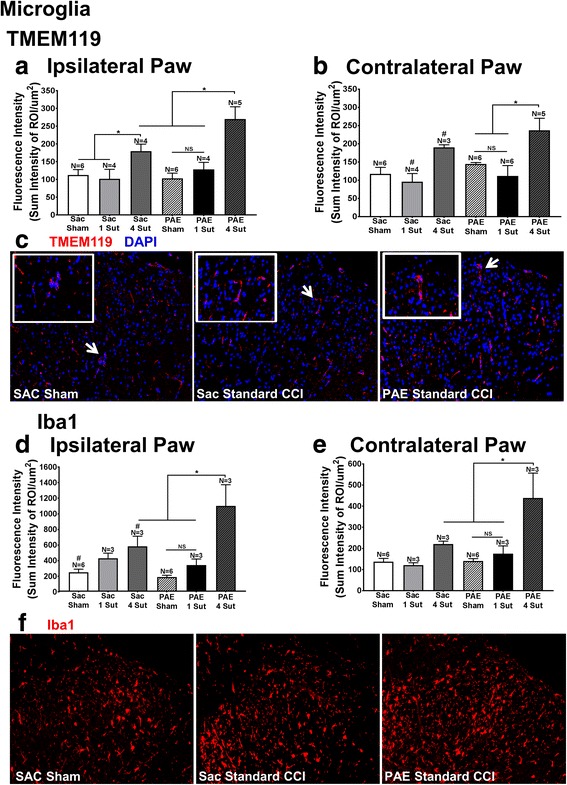
Fig. 3.

Minor CCI does not augment microglial activation in PAE rats. Applying IHC quantification following either standard CCI or minor CCI, two markers to identify alterations in microglial activation were examined: the microglial specific marker TMEM119 and the microglial and macrophage marker Iba1. a, b TMEM119 IR revealed a main effect of surgery [ipsilateral: F2,23 = 16.49, p < 0.0001; contralateral: F2,24 = 10.16, p = 0.0006]. Comparisons a priori of TMEM119 IR (a, b) showed that following standard CCI, PAE rats display elevated bilateral microglial activation compared to the PAE sham condition as well as PAE rats with minor injury. TMEM119 IR was also significantly elevated in PAE rats with standard CCI compared to Sac rats with standard CCI within the ipsilateral dorsal spinal cord. Sac rats with standard CCI displayed elevated TMEM119 IR within the ipsilateral dorsal spinal cord compared to Sac sham rats. These rats also revealed bilateral increases in TMEM119 IR compared to Sac rats with minor injury. No significant differences in TMEM119 IR were seen between PAE sham and PAE minor CCI conditions. d, e Iba1 results reveal a main effect of surgery [ipsilateral: F2,18 = 21.04, p < 0.0001; contralateral: F2,18 = 13.6, p = 0.0003]. Iba1 comparisons a priori (c, d) revealed significantly elevated IR in PAE with standard CCI compared to PAE sham rats, PAE rats with minor injury, as well as Sac rats with standard CCI. Sac rats with standard CCI had significantly elevated Iba1 IR compared to Sac sham rats in the ipsilateral dorsal spinal cord and contralateral spinal cord. No significant differences were seen between PAE sham and PAE minor CCI conditions. e Representative images of TMEM119 IR and f Iba1 IR that were included in the IHC analysis are shown for Sac Sham rats, Sac rats with standard CCI, and PAE rats with standard CCI at 20x. Inset for TMEM119 is shown at 60x. Asterisks indicate p < 0.05. NS indicates not significant. The data are presented as the mean ± SEM
