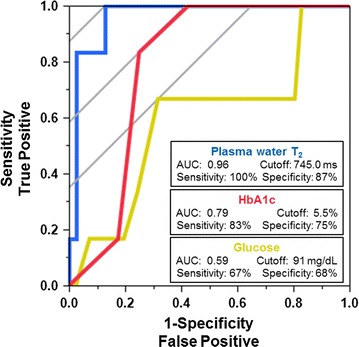
Fig. 2.

Receiver operator characteristic (ROC) curves to quantify the ability of different diagnostic tests to detect early insulin resistance (metabolic syndrome), as defined by the McAuley Index. Blue (left curve): plasma water T2; Red (middle curve): hemoglobin A1c; Yellow (right curve): glucose. An ideal ROC curve follows the left and top axes and intersects with the (0,1 coordinate)
