
Fig. 3. G93A-SOD1 mice treated by genome editing have more ChAT+ cells at end stage compared to control mice.
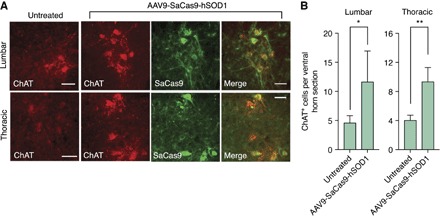
(A) Immunofluorescent staining of end-stage (top) lumbar or (bottom) thoracic spinal cord sections after G93A-SOD1 mice were injected with AAV9-SaCas9-hSOD1 or left untreated. (B) Mean number of ChAT+ neurons per end-stage (left) lumbar or (right) thoracic spinal cord hemisection after G93A-SOD1 mice were injected with AAV9-SaCas9-hSOD1 or left untreated (n = 4). Scale bars, 50 μm. Error bars indicate SD. *P < 0.05; **P < 0.001; two-tailed unpaired t test.