
Figure 3.
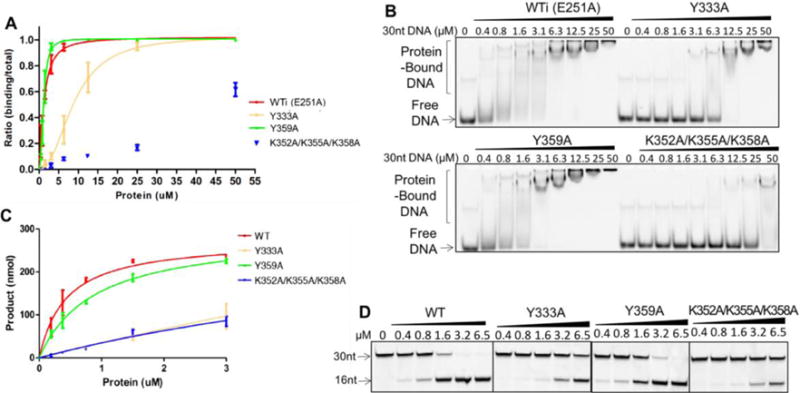
EMSA assay (A, B) and deamination assay (C, D) of A3F-CD2 and mutants with a 30 nt substrate ssDNA. For the DNA binding assay, A3F-CD2 catalytic E251A mutant (WTi) and the corresponding mutants were used to avoid complication of substrate turnover during DNA binding, but the wild-type catalytic E251 residue was restored in the corresponding mutants for the deamination assay. One set of representative gels from three independent assays for the DNA binding assay is shown in (B) and for the deaminase assay shown in (D). For the deaminase assay, the positions of the the 30 nt substrate ssDNA and the 16 nt deamination product ssDNA are indicated. Error bars were calculated in s.e.m. Deamination curves were fitted with the Michaelis-Menten model (see Methods).