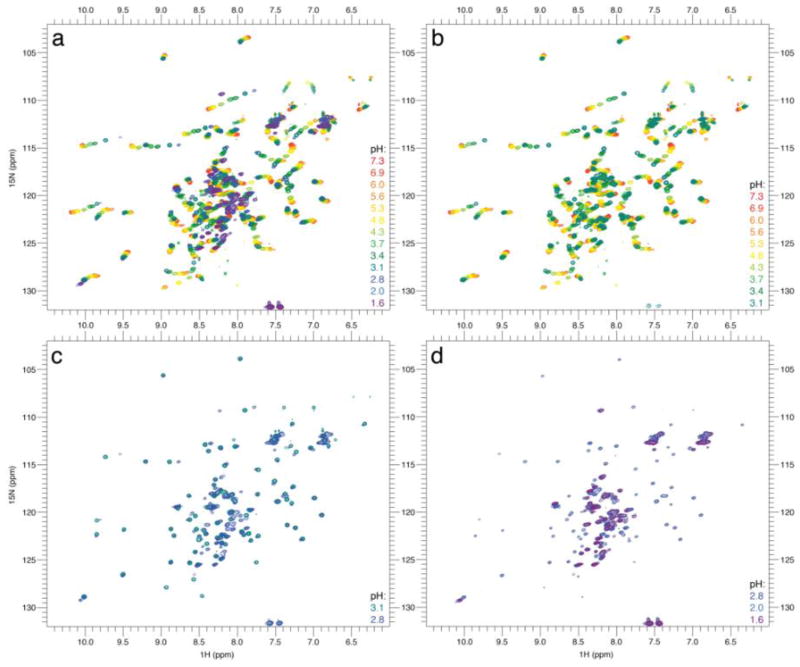
Fig. 2.
Impact of pH changes on HdeA’s NMR signature. (a) Titration from pH 7.3 to 1.6, (b) from 7.3 to 3.1, (c) from 3.1 to 2.8, and (d) from 2.8 to 1.6. Color coding: from red to purple with decreasing pH, as indicated in the key at the right of each panel. The assigned spectrum of HdeA is shown in Fig. S8.

