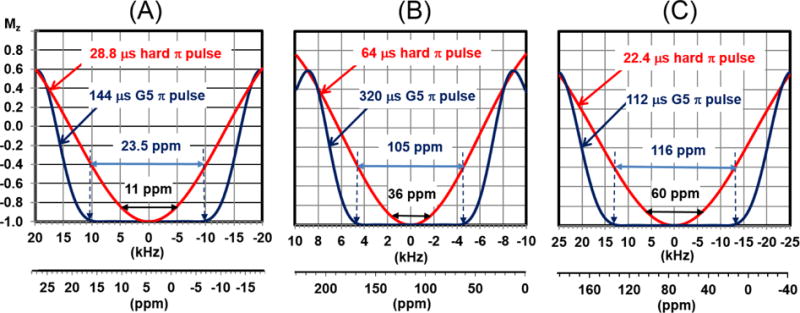
Fig. 2.

Simulated inversion profiles of a hard and G5 π pulses for 1H (A), 15N (B), and 13C (C) on an 850 MHz spectrometer. The simulated curves were obtained using the ‘shapetool’ in the Bruker software. The durations of G5 pulse is ten times longer than a hard π/2 pulses (Note that the durations of hard π/2 pulses for the 1H, 15N and 13C are 14.4, 32.0 and 11.2 μs, respectively). The spectral widths indicated in the axis are those commonly used for biomacromolecules (11, 36, and 60 ppm for 1H, 15N and 13C dimensions). Note that the G5 pulse uniformly excites 23.5, 105, and 116 ppm for 1H, 15N and 13C, respectively.
