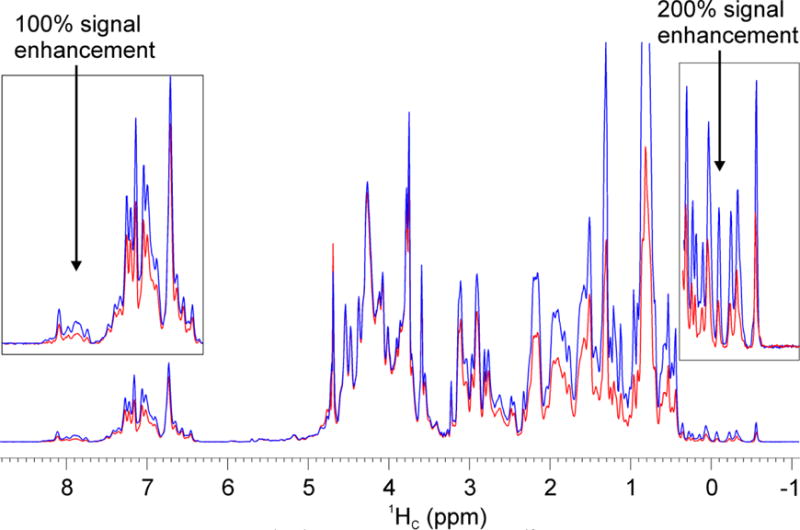
Fig. 6.

1D projections of 2D 1H-1H planes from the 3D 13C-edited NOESY-HSQC spectra of U-15N,13C-labeled Abl1b RM acquired on an 850 MHz spectrometer with the original Bruker pulse sequence (red spectrum) (noesyhsqcetgpsi3d, Fig. S5); replacing 1H and 13C hard and shaped π pulses with G5 (blue spectrum). The inset shows both the lower and high field regions of the spectrum. Acquisition parameters: d1 = 1 sec, d8 = 0.15 sec (mixing time), ns = 64 (number of scans), TD = 2k×256, p1 = 11.3 μs (the length of 1H π/2 hard pulse), p3 = 11.2 μs (the length of 13C π/2 hard pulse), the offsets of 1H and 13C are 4.7 and 75 ppm, respectively.
