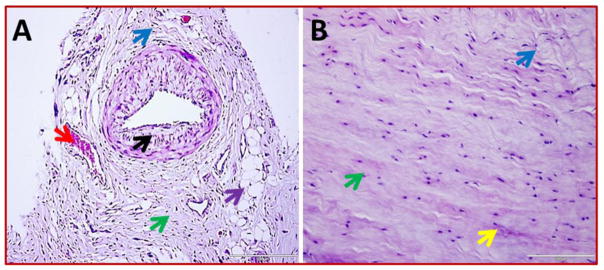
Fig. 2.
Representative images for H&E staining of biceps tendons – (A) Group-1 (represents four patient) and (B) Group-2 (represents four) showing difference in tissue organization. ECM disorganization and inflammation are more prominent in Group-1. The key features are indicated by colored arrows: green arrows - tendon cells, black arrows – inflammation, red arrows – angiogenesis, blue arrows - ECM disorganization, violet - fatty infiltration, and yellow arrows - normal ECM with dense collagen deposition. The Figs are shown in 400× magnification.

