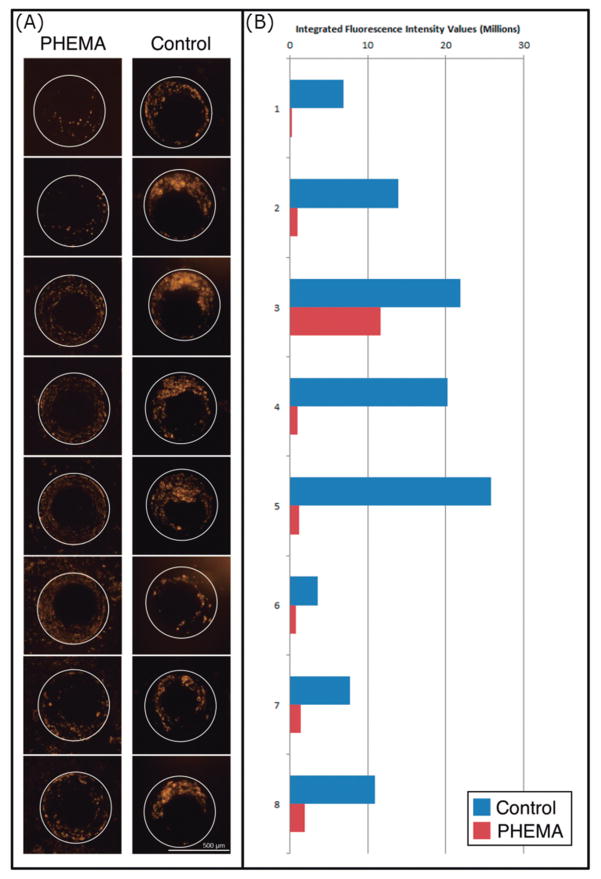
Fig. 6. Representative rhodamine-phalloid actin stain imaging for control and PHEMA CSF intake holes alongside calculated integrated fluorescence intensity values.
(A) Eight representative CSF intake hole maximum projection images from the PHEMA coated and uncoated control catheter are shown at the 17-day time point. (B) The measured integrated fluorescence intensity values for the holes imaged are shown graphically. The CSF intake holes imaged are numbered one through eight, with hole one being closest to the catheter tip (most distal) and hole eight being closest to the alginate matrix loaded with cultured astrocytes and microglia (most proximal).

