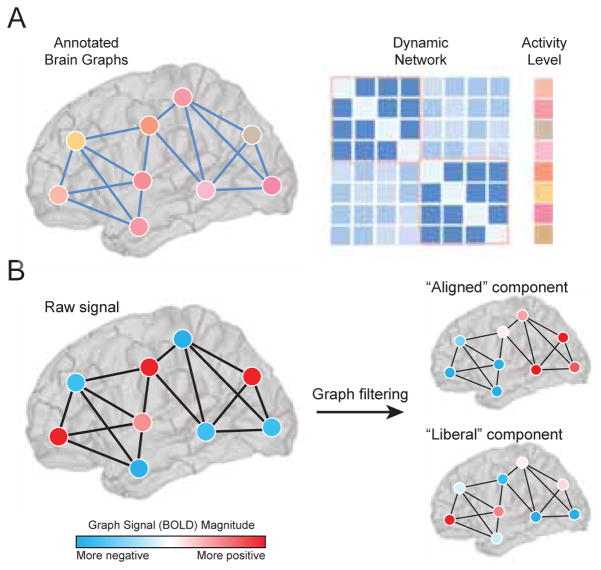
FIG. 5. Brain activity on brain graphs.
(A) Annotated graphs enable the investigator to model scalar or categorical values associated with each node. These graphs are represented by both an adjacency matrix A of dimension N × N, and a vector x of dimension N × 1 (Adapted from [151]). (B) Graph signal processing allows one to interpret and manipulate signals atop nodes in a mathematical space defined by their underlying graphical structure. A graph signal is defined on each vertex in a graph. For example, the signal could represent the level of BOLD activity at brain regions interconnected by a network of fiber tracts. Graph filters can be constructed using the eigenvectors of A that are most and least aligned with its structure. Applying these filters to a graph signal decomposes it into aligned/misaligned components. Elements of the aligned component will tend to have the same sign if they are joined by a connection. The elements of the misaligned or “liberal” component, on the other hand, may change sign frequently, even if joined by a direct structural connection.

