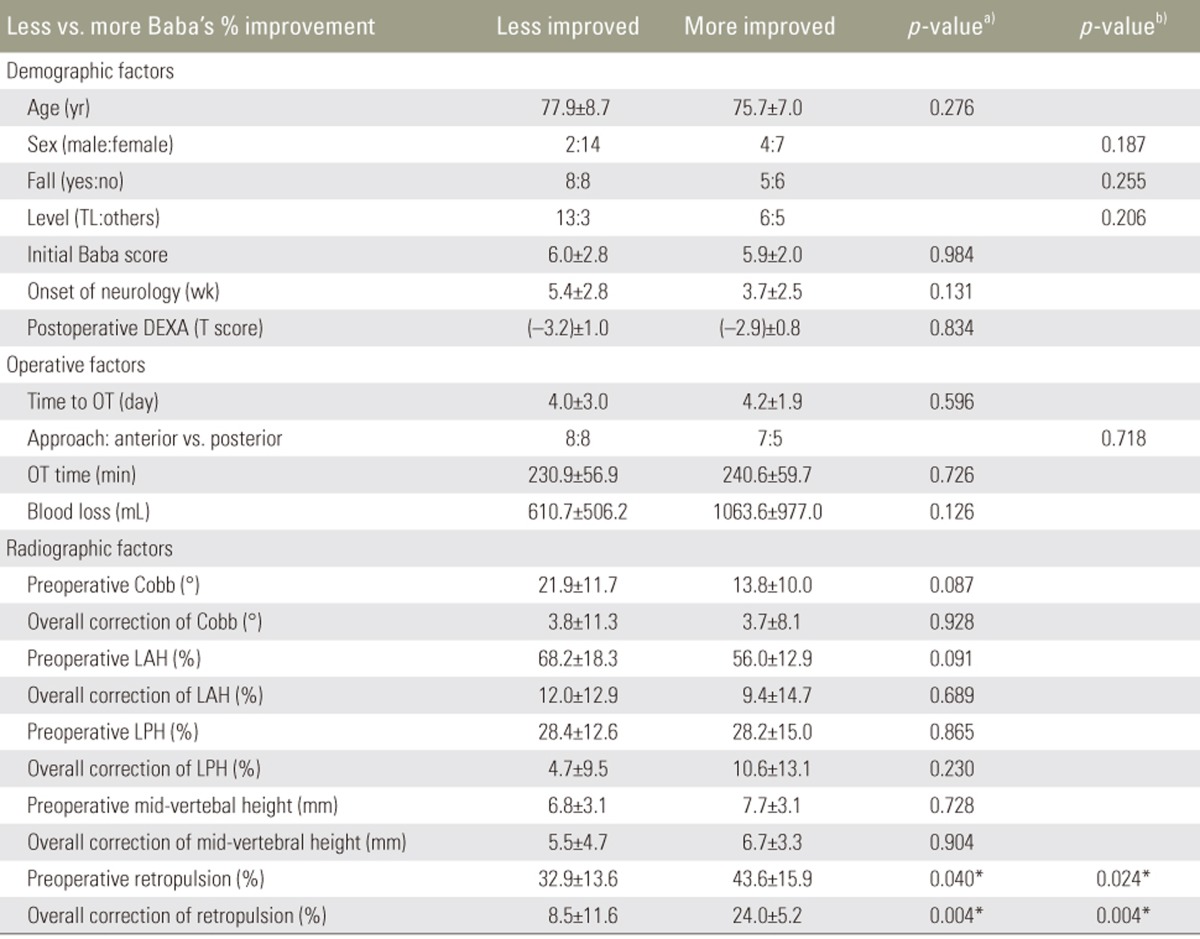
Table 3. Baba's improvement correlation (less improved: ≤60%; more improved: >60%) with different factors.
Values are presented as mean±standard deviation.
TL, thoracolumbar; DEXA, dual-energy X-ray absorptiometry; OT, operation; LAH, loss of anterior vertebral height; LPH, loss of posterior vertebral height.
a)Mann-Whitney U test; b)Fisher's Eaxct test; *A p-value with statistical significance (p<0.05).

