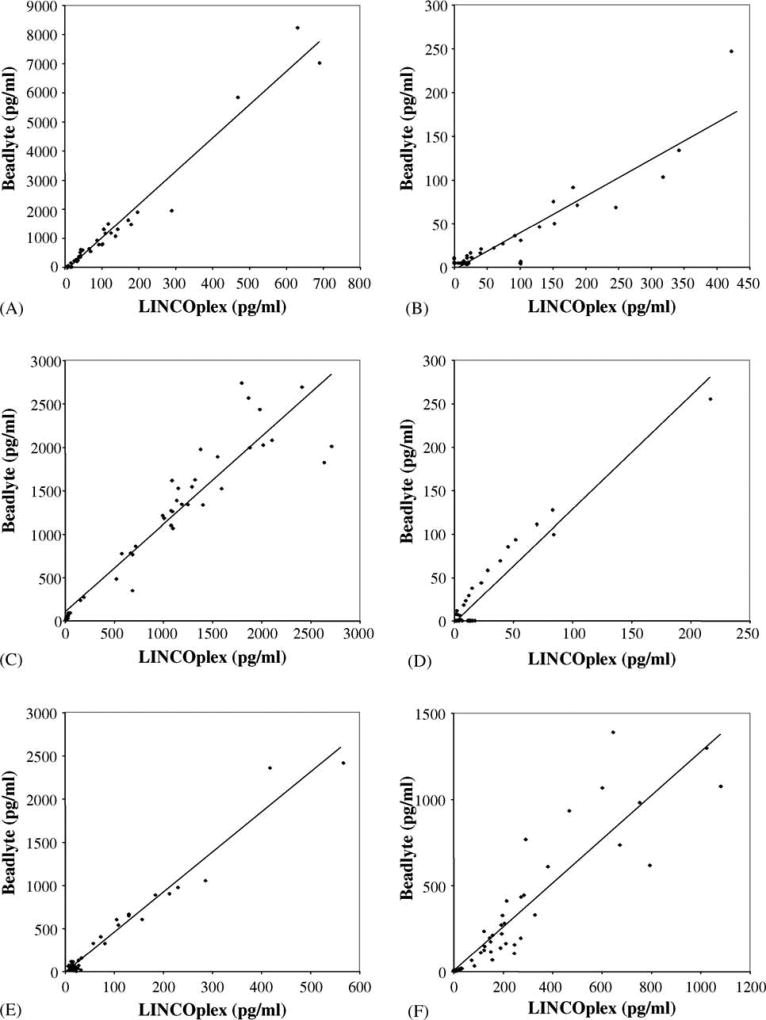
Fig. 4.
Scatter plots of LINCOplex cytokine and Beadlyte multiplex cytokine kit determinations. Panel A represents data obtained for IL-1β, r = 0.9824. Panel B represents data obtained for IL-4, r = 0.9147. Panel C represents data obtained for IL-10, r = 0.9410. Panel D represents data obtained for IL-13, r = 0.9565. Panel E represents data obtained for IFN γ, r = 0.9825. Panel F represents data obtained for TNF α, r = 0.9057. Best-fit trend lines are depicted for each graph. All samples analyzed with both kits (n = 48) are included in these analyses.

