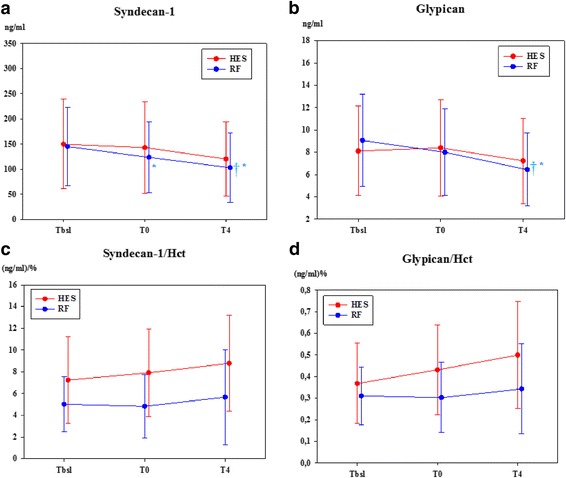
Fig. 4.

Endothelial function. Plasma concentrations of syndecan-1 (a), glypican (b), syndecan-1 hematocrit ratio (c) and the glypican hematocrit ratio (d) are delineated. Data are presented as mean ± standard deviation. HES = colloid group, RF = crystalloid group. *p < 0.05 significantly different from T bsl. † p < 0.05 significantly different from T 0. # p < 0.05 significantly different between groups
