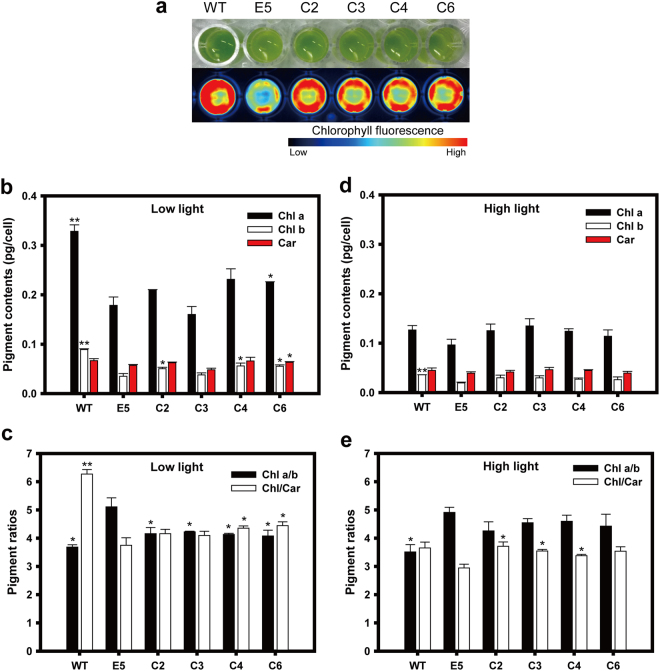
Figure 2.
Analysis of chlorophyll fluorescence and pigments. (a) Visible phenotypic differences and chlorophyll fluorescence as visualized by blue epi-illumination and a 695/55 nm filter using a ChemiDoc system (Bio-Rad, USA). (b) Pigment contents and (c) pigment ratios of C. vulgaris wild type (WT), E5 and complemented strains grown under a low light condition (50 μmol photons m−2 s−1). (d) Pigment contents and (e) ratios of cells grown under a high light condition (300 μmol photons m−2 s−1). Total chlorophyll content (sum of Chl a and Chl b) was used to calculate Chl/Car ratio. The data represent the average of samples and the error bars indicate the standard error (n = 2). Significant differences between E5 and other strains (WT and complemented strains) were determined by Student’s t tests and are indicated by asterisks (*P < 0.05, **P < 0.01, ***P < 0.001).

