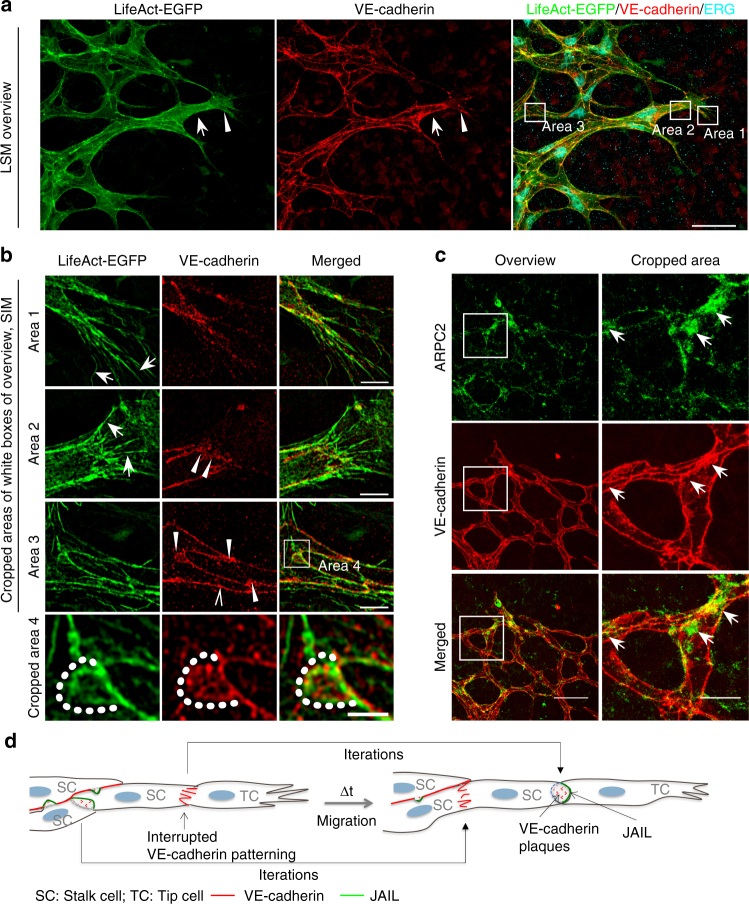
Fig. 3.
Polarized distribution of VE-cadherin and actin in sprouting ECs in developing mice retinas. a Laser scanning microscopy (LSM) showing an overview of the front area of a whole-mounted P6 transgenic mouse retina expressing LifeAct-EGFP additionally immune stained with anti-VE-cadherin and anti-ERG antibodies; nuclei were stained with anti-ERG. Tip cell (arrowheads) and adjacent stalk cell (arrows) are indicated. Scale bar: 40 µm. b High-resolution SIM of selected areas 1–3, as indicated in the right panel of a. Shown is one z-plane. (Area 1) a characteristic tip cell with large actin-based filopodia and a cytosolic spotted VE-cadherin pattern. (Area 2) A tip cell/stalk cell junction at the cell pole of elongated cells identifies terminating actin filaments (arrow) and an interrupted VE-cadherin pattern (arrowhead). (Area 3) a stalk cell/stalk cell connection. VE-cadherin plaques are indicated at the cell poles (arrowheads) and a linear VE-cadherin pattern (empty arrowhead) at lateral junctions; parallel actin filaments are also visible. Scale bar: 5 µm. (Area 4) The cropped area depicts an actin-positive JAIL (dotted line, LifeAct-EGFP) with VE-cadherin plaques (dotted line, VE-cadherin staining). Scale bar: 2 µm. c P7 rat retina immune labelled with ARPC2 and VE-cadherin show increased ARPC2 at the cell poles (arrows). Scale bars in the left panels and right panels represent 50 and 15 µm, respectively. d Scheme illustrates the iterative dynamics of VE-cadherin interruption and JAIL formation leading to VE-cadherin plaques in sprouting ECs. The VE-cadherin dynamics was particularly pronounced at the cell poles, while the lateral junctions showed moderate dynamics

