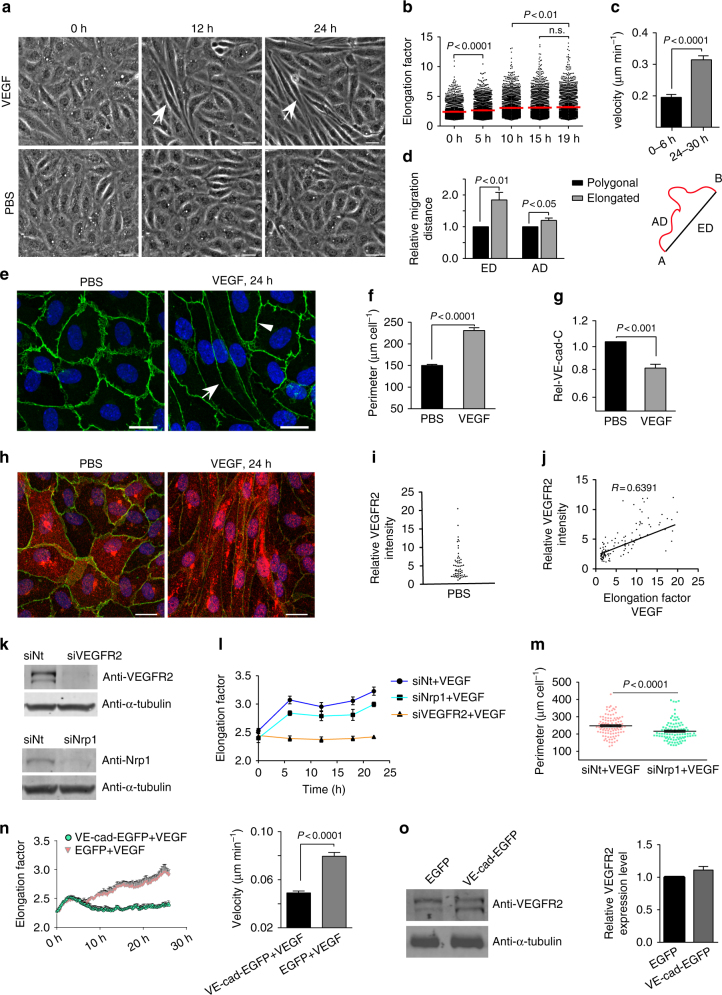
Fig. 4.
VEGFR2 and VE-cadherin expression control VEGF-induced EC elongation and migration. Confluent HUVECs were treated with 50 ng ml−1 VEGF or PBS. a Time-lapse images show cell elongation (arrows) in a subpopulation of HUVECs (Scale bar: 30 µm). b PhaCoB Cell Tracker analysis of cell elongation 5 h after VEGF (n = 3070 cells, one-way ANOVA). c VEGF-dependent cell velocity in the first 6 h (n = 71 cells) and after 24 h (n = 77 cells). d Elongated cells displayed increased 'Euclidean distance' (ED) and 'Accumulated distance' (AD) comparison to polygonal cells in the same VEGF-treated culture (n = 30 cells from t = 24–30 h, two-way ANOVA). e Anti-VE-cadherin-labelled HUVEC cultures. Rel-VEcad-C was decreased in a subpopulation of elongated cells (arrow) but not in polygonal cells (arrowhead) (scale bar: 20 µm). Quantification of (f) cell perimeter and (g) Rel-VEcad-C based on immunofluorescent labelling using the CBT. h HUVECs were stained with VE-cadherin (green) and VEGFR2 (red) (scale bar: 20 µm). i Quantitative distribution of the relative VEGFR2 intensity under PBS (n = 59 cells). j Correlation of relative VEGFR2 intensity with elongation factor in VEGF-treated HUVEC; n = 146 cells; R = correlation coefficient. k Western blot demonstrates downregulation of VEGFR2 and Nrp1 by the respective siRNAs but not non-targeting siRNA (siNt). l VEGFR2 downregulation totally blocked VEGF-induced cell elongation as determined by PhaCoB Cell Tracker, whereas Nrp1 downregulation had only a minor effect (n ≈ 3500/time point), compare Supplementary Movie 6. m A small but statistically significant decrease in the perimeter in Nrp1-downregulated cells quantified based on VE-cadherin-labelling using CBT (n = 100 cells). n (left) VE-cadherin-EGFP overexpression blocked the VEGF-induced elongation as analysed by PhaCoB Cell Tracker (n ≈ 1100 cells/time point). (right) Determination migration velocity of VE-cadherin-EGFP (n = 100 cells) and EGFP (n = 101 cells) overexpressing HUVEC in the presence of VEGF for 24 h. Compare supplementary movie 7. o (left) Western blot of VEGFR2 expression after VE-cadherin-EGFP overexpression. (right) Quantification of VEGFR2 expression in VE-cadherin overexpressing cells (n = 3). α-tubulin served as an internal loading control. Unpaired student’s t test was used to analyse the significance difference for experiment c, f, g, m, n, o. Error bars represent ± SEM. Representative results from three independent experiments are shown

