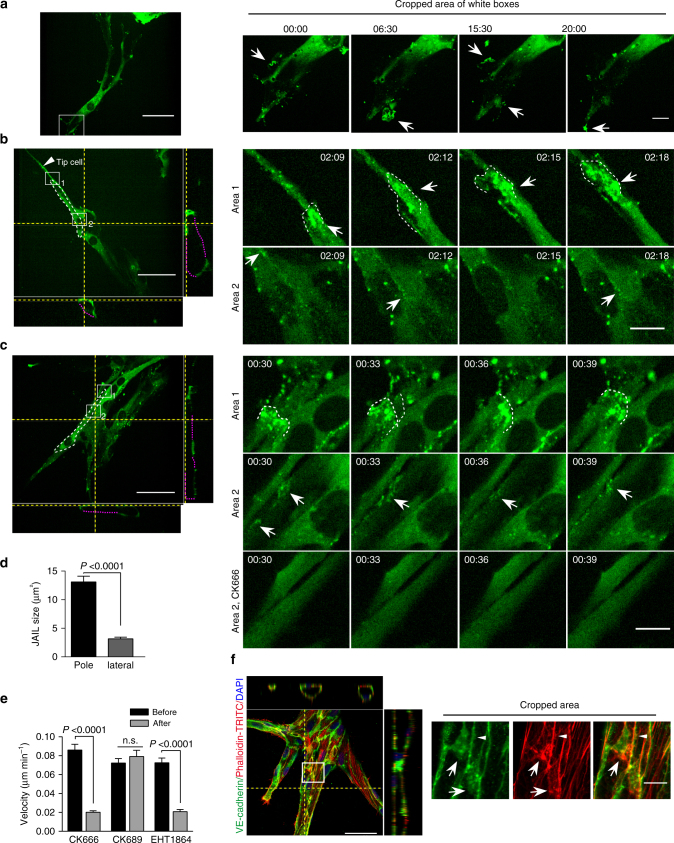
Fig. 9.
Polarized JAIL dynamics during sprouting angiogenesis in fibrin angiogenesis assay using EGFP-p20 expressing HUVECs. a–c SDM based time-lapse recordings (TLR) of different cell junctions during sprouting angiogenesis. In the overview of b, c, f, Yellow dotted lines indicate the z-projection level. Purple dotted line completes the lumen-forming sprouts since not all cell expressed the fluorescence-tagged protein and white dotted line outlines the cell junctions. a Overview of tip cell sprouts. (cropped area) EGFP-p20-positive plaques identified transient lamellipodia and filopodia at the tip cell front (arrows). b Overview and Z-projection of tip cell/stalk cell junctions. (cropped area) TLR of large JAIL that development at the cell poles (white dotted lines, area 1) and faint and small JAIL appearing at the lateral junction (arrows, area 2). c JAIL formation between stalk cell/stalk cell junctions. (cropped area 1) TLR demonstrate large JAIL formation at the cell pole (dotted line). (cropped area 2, middle panel) Small JAIL developed at lateral junction (arrows). (cropped area 2, lower panel) ARP2/3 complex inhibitor CK666 applied to the same cells blocked JAIL formation. d Quantification of JAIL size in the migrating pole and lateral side of the sprouting ECs. Sixty-four JAIL at the leading cell pole and 45 JAIL at the lateral junctions from 3 movies over a period of 30 min were analysed, unpaired student’s t test. e Inhibition of cell migration ability after ARP2/3 complex inhibitor (CK666) and inactive control inhibitor (CK689) and Rac inhibitor EHT1864. Quantification is based on phase-contrast time-lapse recordings for the time period up to 6 h; n = 67, 70, 82 cells before and 69, 70, 85 cells after CK666, CK689, or EHT1864 treatment, respectively. Cells were pooled from two independent experiments; two-way ANOVA. f Overview and Z-projections of vessel sprouts in fibrin angiogenesis assays 5 days after seeding; cells were fixed and labelled with Phalloidin-TRITC and VE-cadherin. (cropped areas) JAIL are indicated at cell poles by the appearance of large VE-cadherin plaques (arrows) that co-localise with the actin network (arrows), whereas small VE-cadherin plaques appear at lateral junctions (arrowhead). Error bars represent ± SEM; scale bars indicate 50 and 10 µm in the overview and cropped areas, respectively

