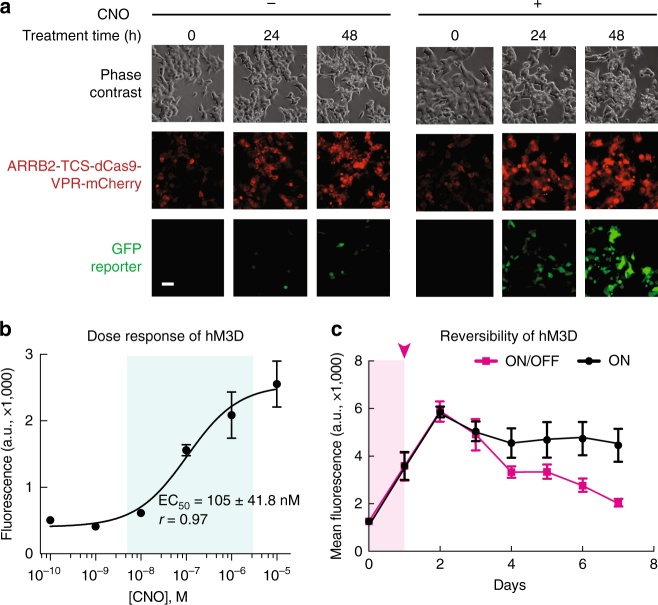
Fig. 2.
Characterization of kinetics and dose response of the CRISPR ChaCha system. a Time-lapse imaging of stable HEK293T cells containing hM3D-CRISPR ChaCha (see Supplementary Fig. 1 for plasmid architecture) over 48 h with or without CNO treatment. Scale bar, 50 μm. b The dose–response curve of hM3D-CRISPR ChaCha in HEK293T cells after 1-day treatment of different CNO concentrations. EC50, the effective ligand concentration to achieve half-maximal GFP induction, and is shown as mean ± standard deviation of three technical replicates. The biological replicate experimental data is shown in Supplementary Fig. 5. c Reversibility of the hM3D-CRISPR ChaCha system. 10 μM CNO was added to cells for 1 day (shaded magenta area) and removed after day 1 (magenta curve). As a positive control, cells were grown with CNO for 7 days (black). Each data point represents the mean of GFP fluorescence of six technical replicates from two independent experiments, and the error bars represent the standard error of the mean. See Methods section for detailed experimental procedure

