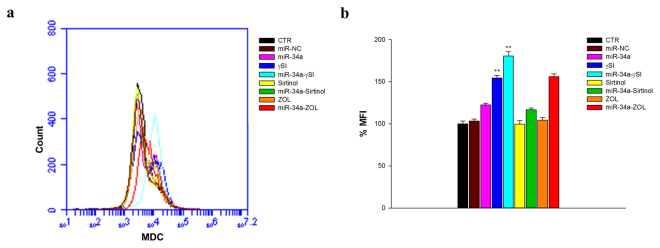
Figure 7.
Flow cytometric analysis of autophagy. RPMI 8226 cells were transfected with miR-34a or miR-NC and treated for 48 h with γSI, Sirtinol and ZOL, as described in “Methods”. After MDC staining, cells were analysed on the BD Accuri C6™ flow cytometer (a). (b) The histogram shows the relative MFI with respect to control sample. The results are shown as means ± standard deviation (SD) for three independent experiments. *p ≤ 0.05; **p ≤ 0.01; ***p ≤ 0.001.

