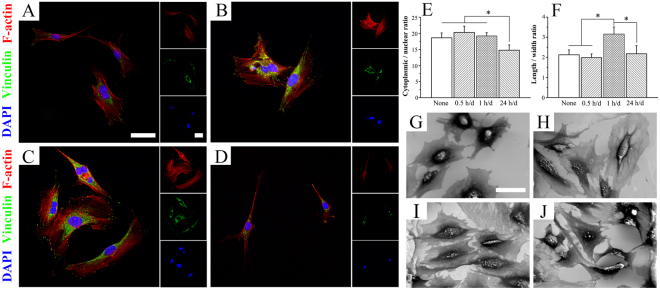
Figure 3.
Typical FA and cytoskeleton immunofluorescence evolution of cells with daily stimulation time of 0.5 h/d (B), 1 h/d (C) and 24 h/d (D) after 2 days of culture. Cells were stained for the actin cytoskeleton (red), the FA protein vinculin (green), and cellular nuclei (blue). Quantitative analysis of the ratio of cytoplasmic to nuclear area (E) and of length to width of cytoplasm (F) according to the immunofluorescence staining. *p < 0.05. The morphologies of cells on Ppy IDE with no stimulation (G) and with the daily stimulation time of 0.5 h/d (H), 1 h/d (I) and 24 h/d (J) for 2 days of culture. The images share the same scale bar of 50 μm.

