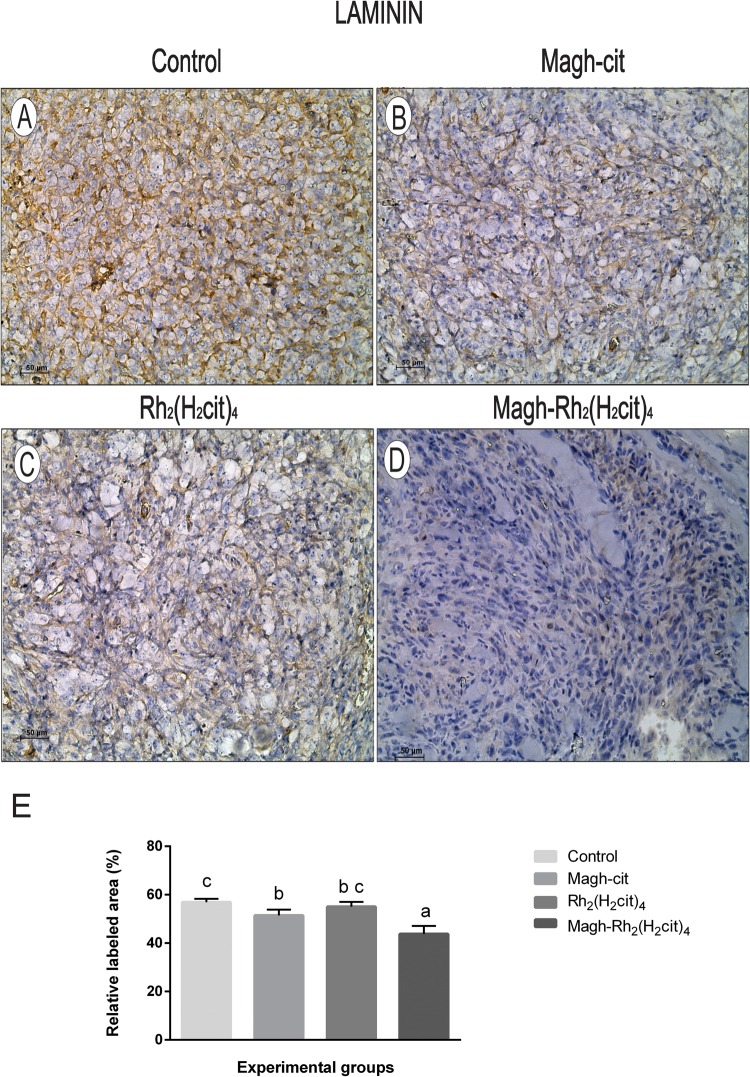
Figure 5.
Representative images of laminin immunohistochemical detection in tissue of Balb/c mice from each experimental group. (A) Control, (B) Magh-cit, (C) Rh2(H2cit)4, (D) Magh-Rh2(H2cit)4, (E) Quantification of LN staining decreased markedly after Magh-Rh2(H2cit)4 treatment when compared to control mice. The data represent the average of 10 photos of each group. (A–D) IHC, DAB chromogen, Mayer’s Hematoxylin counterstain, Original magnification 200x. Data represent mean values ± standard error and different letters indicate statistical difference among treatments (p < 0.05). Scale bars: 50 µm.

