Fig. 4.
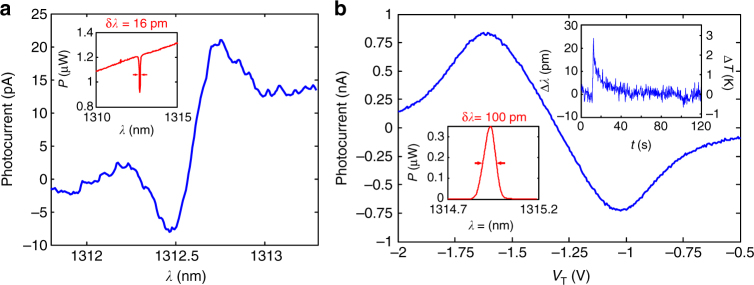
Applications of resonance modulation spectroscopy. a Gas sensing demonstration, where an HF absorption line at 1312.591 nm is measured in transmission using the resonance modulation scheme previously described. Voltage was translated into wavelength using a calibration curve obtained from independent PL cavity mode tuning data. A superluminescent diode (SLED) fiber-coupled to an HF gas cell (at p = 50 Torr), and filtered with a 12 nm wide 1310 nm band pass filter is used for excitation. A filter is needed to isolate a single absorption line, and a single cavity mode; inset: optical spectrum analyzer (OSA) spectrum of the SLED with the HF cell inserted, showing the same absorption line. b Wavemeter measurement of a FBG resonance in reflection performed using the resonance modulation scheme. A SLED is connected to the first input of a 2 × 2 fiber beam-splitter with the FBG on one of the outputs, and the second input (reflection) is coupled to the cavity through a NA = 0.45 objective (P in ≈ 1.6 μW). The FBG peak (100 pm wide) is read by sweeping a cavity mode (δλ c = 237 pm, δV c = 270 mV), having a sensitivity (slope at zero crossing) of S I = 3.53 nA V−1. The noise measured at the zero crossing is δI noise = 3.6 pA Hz−1/2 that translates to a peak wavelength uncertainty of δλ noise = (δI noise/S I) × (δλ c /δV c) = 0.9 pm Hz−1/2. Inset left: the OSA spectrum of the FBG filter in reflection. Inset right: detuning of the FBG peak (left axis) and corresponding temperature shift (right axis) over a period of 120 s measured using the cavity sensor. The peak visible at t = 10 s is induced by convective heating from a heat-gun 50 cm away from the FBG. The current signal (lock-in output) is translated to displacement (∆λ) using the slope S I. The FBG temperature sensitivity is taken to be δλ B /δT = 8.5 pm K−1 (specified by the manufacturer)

