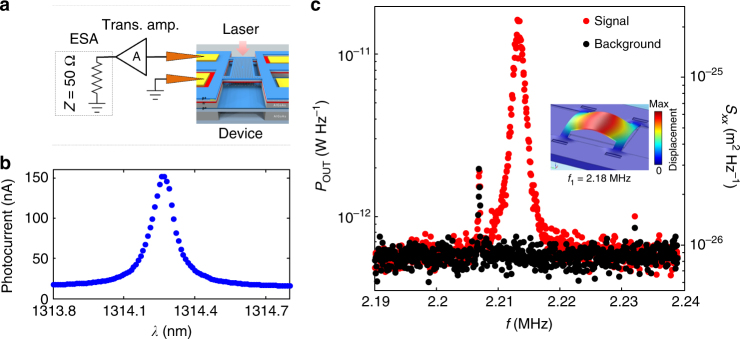
Fig. 5.
Brownian motion detected via photocurrent noise. a Sketch of the measurement circuit, with indicated device, input laser, RF probe, amplifier, and the ESA. An RF probe is used to measure the on-chip photodiode, and the signal is sent via an transimpedance amplifier (A in the setup sketch) to the input of the ESA. The device was mounted in a vacuum chamber (pressure below 10−4 mbar). In this experiment, no bias is supplied to the tuning diode. b Photocurrent measurement of the cavity optical mode for the laser input power P in = 100 μW. c ESA spectrum of the photocurrent noise where the fundamental mechanical mode is visible in the output power (red dots) and control measurement with laser off (black dots). The right axis shows the calibrated power spectral density of motion. The CW laser was coupled into the cavity and the laser wavelength was red-detuned from resonance to the wavelength where the photocurrent varies maximally with detuning (λ L = 1314.29 nm) and its power was kept low enough so as not to excite self-oscillations (P in = 100 μW). The two other sharp features present in both measurements originate from the environmental RF noise; inset: 3D displacement plot of the 4-arm bridge fundamental mechanical mode with frequency f 1 = 2.18 MHz simulated using Comsol

