Fig. 1.
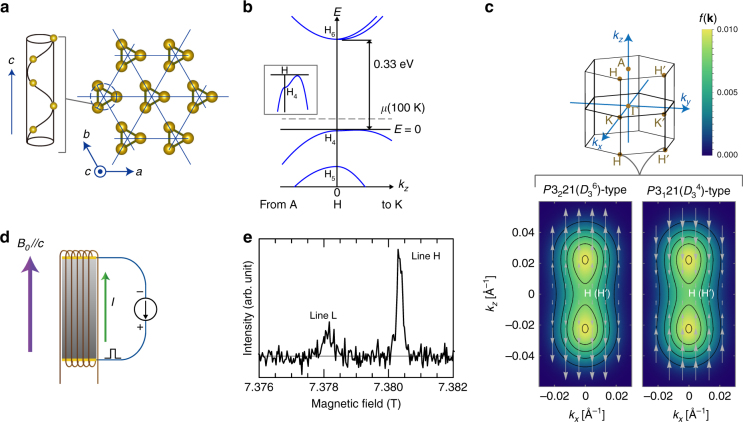
Basic properties of trigonal tellurium and experimental setup. a The crystal structure of the trigonal tellurium with the right-handed structure (P3121(D34)) consists of threefold-symmetric helical chains. b Schematic band structure of trigonal tellurium around the H and H’ points in the first Brillion zone. The two points are related by a time reversal operation. The chemical potential at 100 K is described by the broken line μ(T = 100 K). Inset: zoom on the top of the uppermost valence band. c The first Brillion zone and distribution of the holes at 100 K. Although the holes are not Fermi-degenerate at 100 K, they only belong to the uppermost valence band. The colours of the lower panels represent the distribution function of the holes at T = 100 K, f(k) = 1/[exp{(−E(k) + μ(100 K))/kBT} + 1] (where kB is the Boltzmann constant) and the lines indicate constant f(k) contours: f(k) = 0.002, 0.004, 0.006, 0.008 and 0.01. The arrows represent the direction and the magnitude of the spin of the electron of the uppermost valence band, . The spins are almost parallel to the c axis and radial-like from the H (H’) point. d Geometry of the experiment. A coil for NMR measurements was wound around a single crystal of tellurium. A static magnetic field B0 and a pulsed electric current I were applied parallel to the c axis. e 125Te-NMR spectrum of a single crystal of trigonal tellurium at 100 K under a magnetic field applied approximately parallel to the c axis, in the absence of a pulsed electric current. The spectrum is plotted as a function of the effective magnetic field felt by the 125Te nuclei (see Methods)

