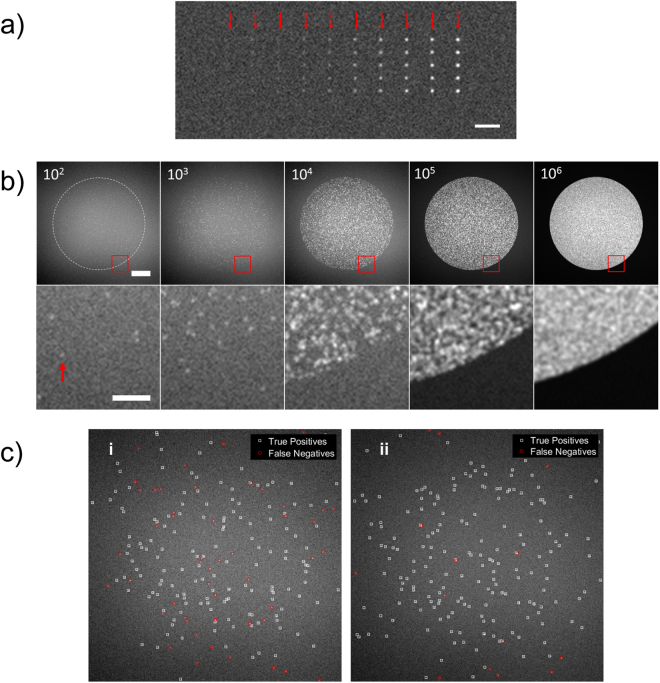
Figure 1.
Synthetic single molecule image data. (a) The synthetic image shows a 10 × 5 test grid of single molecules. From left to right, the signal to noise ratio of the single molecules in each column is 1, 2.5, 3, 4, 5, 6, 7.5, 10, 12.5, 15 and 20. The red arrows indicate each column and helps to identify low signal to noise ratio single molecules. Scale bar is 5 μm. (b) Shown are exemplar images of simulated spots (SNR = 7.5). Each synthetic image is generated with a pre-defined number of single molecules randomly located inside a circular area which is intended to mimic a microarray spot. The labels indicate the number of single molecules on spot (102 molecules per spot is equivalent to a molecule density of 1.27 × 10⁻² μm−2) and the dashed circle in the leftmost image indicates the extent of the microarray spot area. The bottom row of images are zoomed in areas indicated by the red square in the top row. The scale bar for the top row of images is 20 µm, and 5 µm for the bottom row. (c) Images are processed using the image analysis methods under assessment to detect and enumerate the single molecules in each image; this is pre-defined and so the number of single molecules ‘counted’ by each method can be compared to the ground-truth to determine the accuracy as a function of analysis method, number of single molecules per spot and signal to noise ratio of the molecules. (i) and (ii) show exemplar results whereby the counting accuracy is <70% and >90%, respectively. The resolution of all images is 0.26 μm per pixel.

