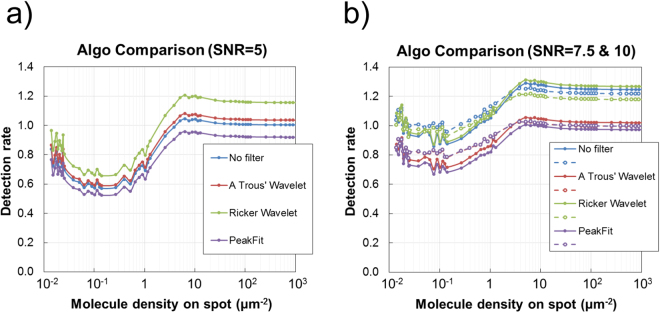
Figure 3.
Congested arrays. In congested images, the number of single molecules is estimated by dividing the total array spot intensity by the average single molecule intensity, which is estimated using the single molecule algorithms described above on non-congested images. Results show the performance of the algorithms to data with a signal molecule signal to noise ratio of (a) 5, (b) 7.5 (solid lines) and 10 (dashed lines). The figure labels ‘No Filter’, ‘A Trous Wavelet’ and ‘Ricker Wavelet’ represent the results when using estimates of average single molecule intensity determined using the intensity thresholding algorithms with either no filters or pre-processing, or pre-processing with the ‘à trous’ or Ricker wavelet transforms, respectively. Similarly, the ‘PeakFit’ figure label represents the results when using an estimate of average single molecule intensity determined using the peak fitting algorithm.

