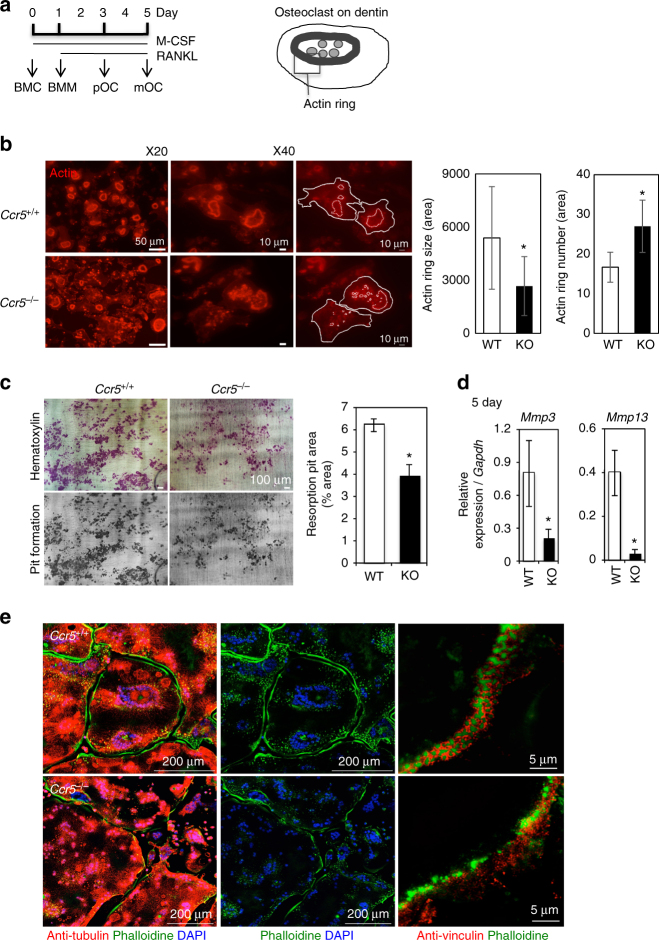
Fig. 2.
The impaired adhesion structures in Ccr5-deficient (Ccr5 −/−) osteoclasts. a (left) A schematic illustration of the time schedule for mouse osteoclast culture from BMCs . (right) A schematic drawing shows the spatial locations of the actin ring (podosome belt) in a mature osteoclast cultured on a dentin slice. b Actin ring formation assays of wild-type (Ccr5 +/+) and Ccr5 −/− osteoclasts on dentin slices. Cells were stained with phalloidin-AlexaFluor568 (shown in red). The magnification of the upper and lower panels was ×20 (scale bars, 50 μm) and ×40 (scale bars, 10 μm), respectively (n = 5). The size and number of actin ring per area were scored and statistically compared. c Resorption pit assays. After matured, the osteoclasts were removed from the dentin slices and were subsequently stained with hematoxylin to visualize the resorption pits. Color images (upper panels) and gray-scale images (lower panels) are shown (scale bars, 100 μm). The resorption pit areas (%) on the gray-scale images were scored and statistically compared (n = 5). d The relative mRNA expression levels of Mmp3 and Mmp13 were measured by a real-time Q-PCR and statistically compared on day 5. The data shown as the mean ± SD (n = 5). e The formation of actin rings (podosome belts) in wild-type and Ccr5 −/− mature osteoclasts was visualized by enhanced resolution confocal imaging (left 4 images, scale bars, 200 μm). The cells were subjected to immunohistochemical staining with anti-tubulin antibodies (shown in red), and were concomitantly stained with phalloidin-AlexaFluor488 and DAPI to visualize the actin rings (shown in green) and nuclei (in blue), respectively (n = 4). SIM images (right two panels) demonstrate the assembly of actin-enriched podosome cores and vinculins in wild-type and Ccr5 −/− mature osteoclasts. The cells were subjected to immunohistochemical staining using anti-vinculin antibodies (shown in red), and were concomitantly stained with phalloidin-AlexaFluor488 to visualize the actin rings (shown in green, scale bars, 5 μm, n = 4). *P < 0.05 by Student’s t-test. All data are shown as the mean ± SD

