Fig. 3.
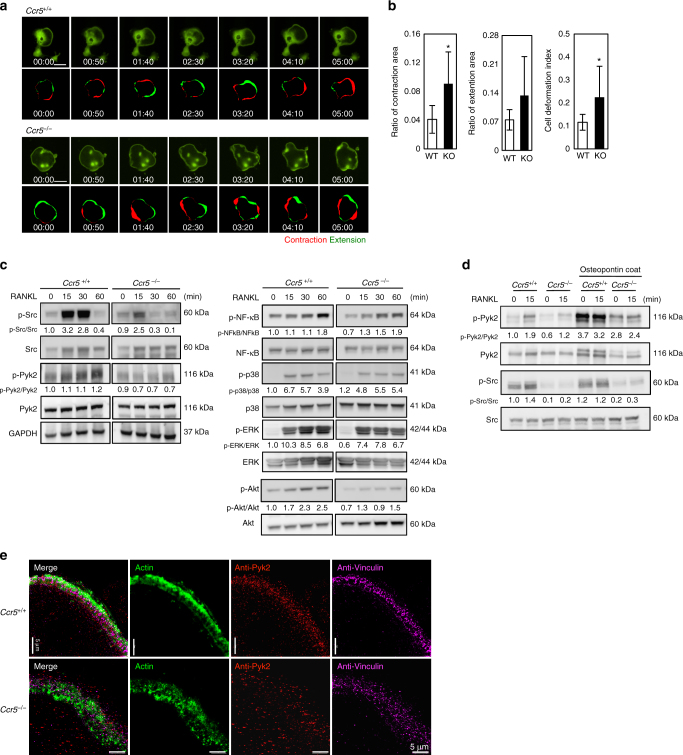
The locomotive and adhesion defects in Ccr5-deficient (Ccr5 −/−) osteoclasts. a Time-lapse microscopy frames show the locomotion of wild-type (Ccr5 +/+) and Ccr5 −/− osteoclasts expressing GFP (scale bars, 100 μm). The patterns of cellular motility were scored with the ratios of the contraction (shown in red) and extension (in green) areas. The contraction and extension areas were scored by 10 min interval time-lapse images. Time-laps movies are shown in Supplementary Movies 1 and 2. GFP-expressing multi-nucleated cells from wild-type and Ccr5 −/− mice were analyzed (n = 9 and 6, respectively). Cells showing the parameters closest to the mean values are shown. b The ratios of the contraction and extension areas, and the cell deformation index (CDI) were analyzed and statistically compared. *P < 0.05 by Student’s t-test. The data shown as the mean ± SD (n = 6–7). c, d BMCs obtained from wild-type and Ccr5 −/− cells were subjected to immunoblotting of phosphorylated Src, Pyk2, NF-κB, p38 and ERK, and Akt. Prior to the analyses, the cells were stimulated by RANKL for the indicated time. The immunoblotting data were replicated more than three times. e Three-dimensional (3D)-SIM images demonstrate the assembly of actin-enriched podosome cores, Pyk2, and vinculins in mature wild-type and Ccr5 −/− osteoclasts. The cells were subjected to immunohistochemical staining using anti-Pyk2 antibodies (shown in red) and anti-vinculin antibodies (shown in pink), and were concomitantly stained with phalloidin-AlexaFluor488 to visualize the actin rings (shown in green). Maximum intensity projection images of 3D-SIM optical slices are shown (scale bars, 5 μm, n = 4). Reconstructed 3D-SIM images are shown in Supplementary Movies 3 and 4

