Figure 3.
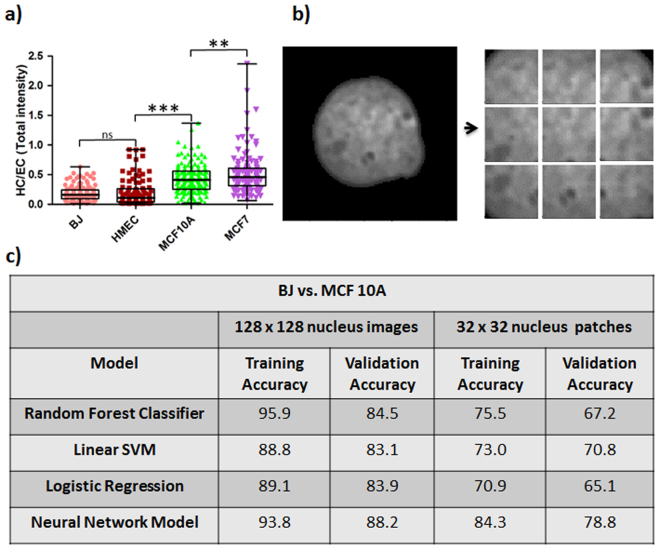
Identification of informative nuclear morphometric features for cancer prognosis. (a) Whisker box plot for HC/EC of normal and cancer cell lines (BJ: n = 134, HMEC: n = 101, MCF10A: n = 156, MCF7: n = 112; Student’s unpaired t-test ***p < 0.0001, **p < 0.0001 and ns = not significant). (b) Analysis of texture features via extraction of nuclear patches of size 32 × 32 pixels with stride size of 16 pixels in either direction. (c) Table indicating differences in accuracy between patch-based classification and classification based on full nuclear images for both neural and linear models.

