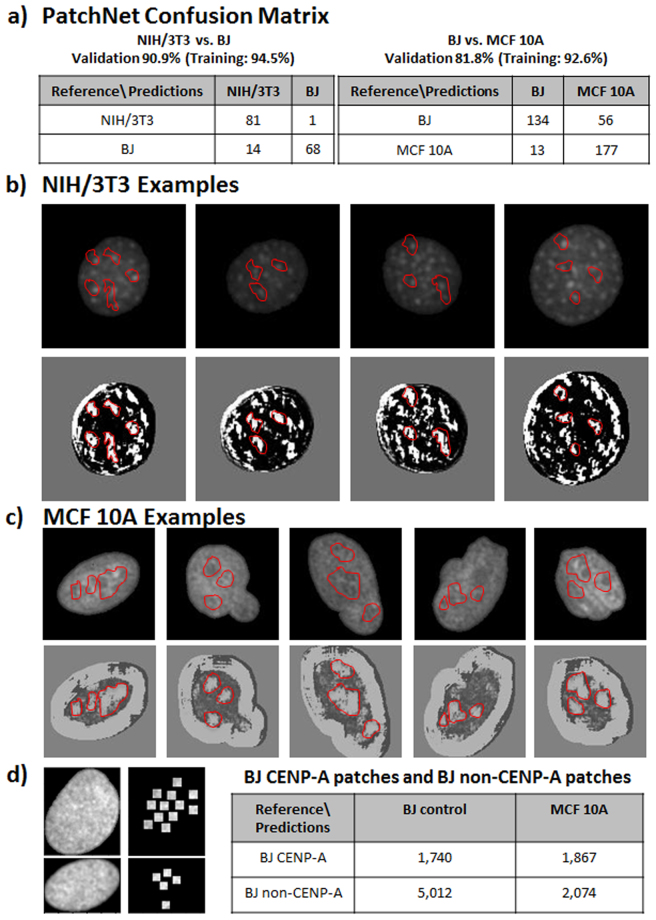
Figure 4.
Functional annotation of the features identified based on a patch-analysis. (a) The confusion matrices for PatchNet in classifying between NIH/3T3 and BJ as well as between BJ and MCF10A. (b) Representative examples of NIH/3T3 nuclei (upper row) together with the features indicative of NIH/3T3 (shown in white) as learned by PatchNet (bottom row). The red masks show examples of regions that were identified by PatchNet as being indicative of NIH/3T3. The predicted NIH/3T3 indicative regions correspond to heterochromatin foci. (c) Representative examples of MCF10A nuclei (upper row) together with the features indicative of MCF10A (shown in white) as learned by PatchNet (bottom row). The red masks show examples of regions that were identified by PatchNet as being indicative of MCF10A. The predicted MCF10A indicative regions correspond to interfaces between heterochromatin and euchromatin regions. (d) BJ nuclei were stained with CENP-A and patches of size 11 × 11 pixels were extracted around the CENP-A marks (left image). The table compares the classification accuracy between CENP-A and non-CENP-A patches, showing that CENP-A patches are more often misclassified as MCF10A.

