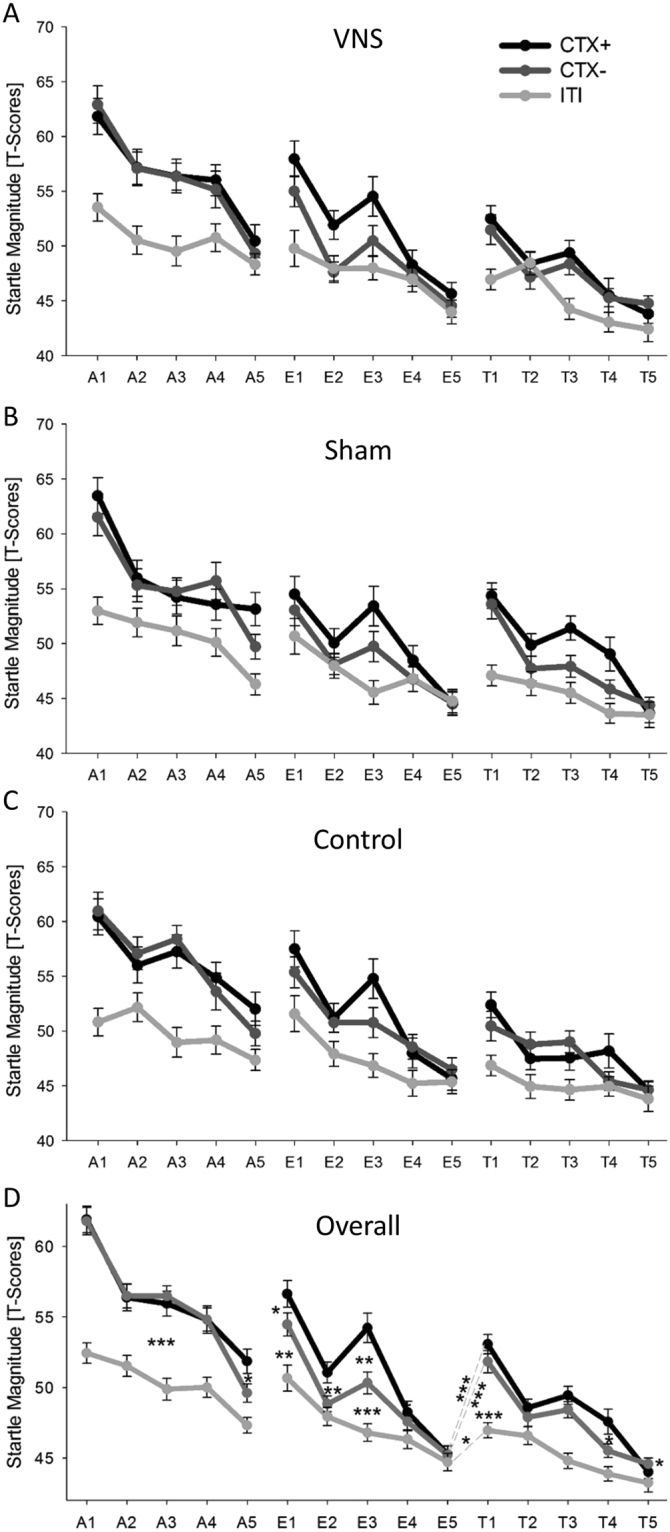
Figure 2.

Startle responses. T-scores of the startle magnitude are depicted in the anxiety context (CTX+), safety context (CTX−) and corridor (ITI) separated by acquisition on the first day (A1-A5), extinction on the second day (E1-E5), and reinstatement/test phase on the third day (T1-T5). Each point on the x-axis depicts the mean of 2 trials. (A), (B) and (C) show startle responses of the VNS group (N = 25), Sham group (N = 25) and control group (N = 25), respectively. (D) depicts the startle responses of all participants (N = 75).
