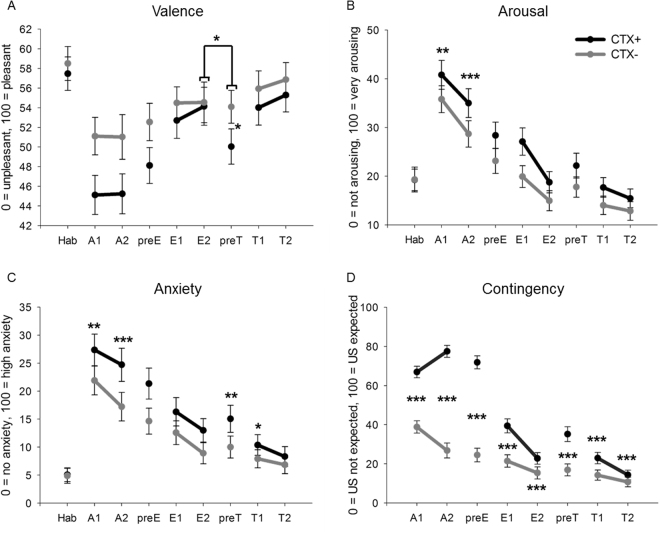
Figure 3.
Ratings for context conditioning. Data for each rating were pooled across all three groups and are shown in one overall graph (N = 75). Circles (with standard errors) depict valence (A), arousal (B), anxiety (C), and contingency (D) ratings for anxiety context (CTX+) and safety context (CTX−). X-Axes show the time of the rating: After habituation (Hab), after Acquisition 1 (A1), and Acquisition 2 (A2) for Day 1, before (preE) and after Extinction 1 (E1) as well after Extinction 2 (E2) for Day 2, and for Day 3 before (preT) and after Test 1 (T1) and Test 2 (T2).

