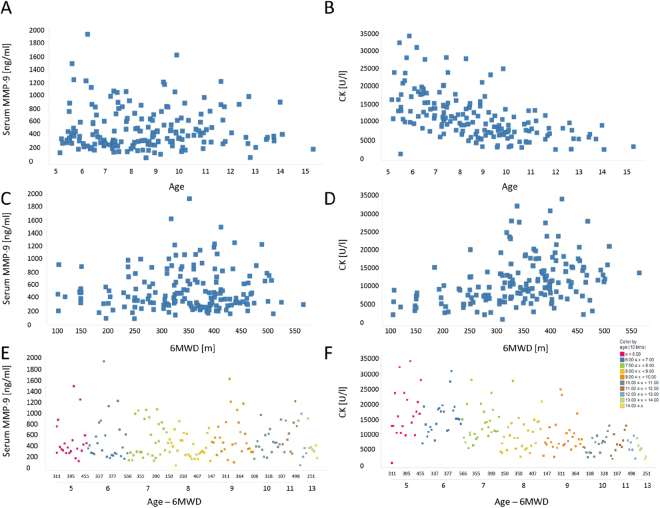
Figure 4.
Relationship between MMP-9, CK, age and 6MWD at baseline in the phase 3 study (NCT01254019 - DMD114044). (A,C,E) Scatter plots showing the relationship between MMP-9 serum levels with age, 6MWD and the combination of age and 6MWD data. (B,D,F) Scatter plots showing the relationship between CK activity levels with age, 6MWD and the combination of age and 6MWD data. In panels E and F, color represents age windows as shown by the legend at the bottom-right and 6MWD are plotted for each age bin.

