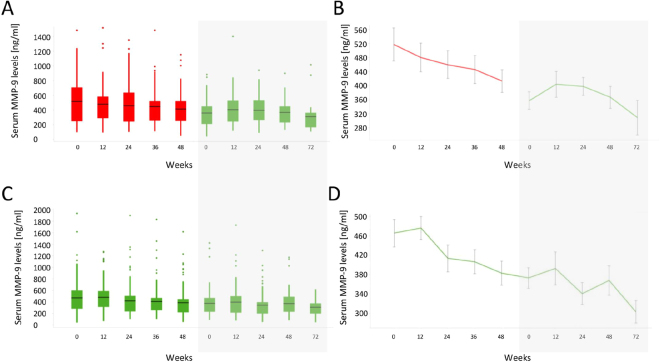
Figure 6.
MMP-9 levels in the open label extension study DMD114349. (A,C) Box plots showing the concentration of MMP-9 in serum during the blinded phase (white background) and during the open label extension (grey background) for both placebo (A) and treatment (C) arms. (B,D) Line plots showing the mean MMP-9 serum concentration during the blinded phase and open label extension phase for both placebo (B) and treatment (D) arms. Data are presented as mean MMP-9 and error bars depict the standard error of the mean.

