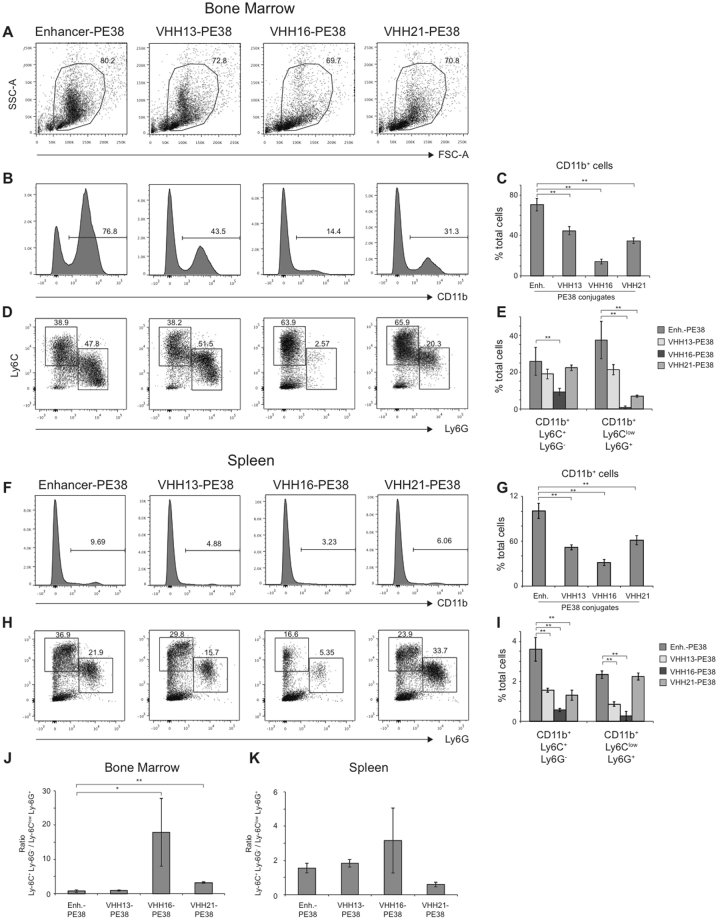
Figure 4.
in vivo activity of VHH-PE38 immunotoxins. C57BL/6 mice were injected intravenously with (GFP-specific) Enhancer-, VHH13-, VHH16- or VHH21-PE38 immunotoxins. After 24 hours myeloid cell composition was monitored in the spleen and bone marrow. (A) Dot plot shows FSC-A vs SSC-A parameters of whole bone marrow of mice injected with indicated immunotoxins. (B) CD11b expression on live bone marrow cells. (C) Percentage of CD11b+ cells in living (SYTOX Blue negative) bone marrow cells. (D) Ly-6G vs Ly-6C expression gated on CD11b+ live (SYTOX Blue negative) bone marrow cells. (E) Percentage of CD11b+Ly-6C+Ly-6G− and CD11b+Ly-6ClowLy-6G+ in living bone marrow cells. (F) CD11b expression on live (SYTOX Blue negative) splenic cells. (G) Percentage of CD11b+ cells in live (SYTOX Blue negative) splenic cells. (H) Ly-6G vs Ly-6C expression gated on CD11b+ live (SYTOX Blue negative) splenic cells. (I) Percentage of CD11b+Ly-6C+Ly-6G− and CD11b+Ly-6ClowLy-6G+ in live (SYTOX Blue negative) splenic cells. (J) Bar histograms show the CD11b+Ly-6C+Ly6G−/CD11b+Ly-6ClowLy-6G+ cell ratio in the bone marrow. (K) Bar histograms show the CD11b+Ly-6C+Ly6G−/CD11b+Ly-6ClowLy-6G+ cell ratio in the spleen. *p value < 0.05, **p value < 0.01 on Student-T test. Representative of 2 independent biological experiments.

