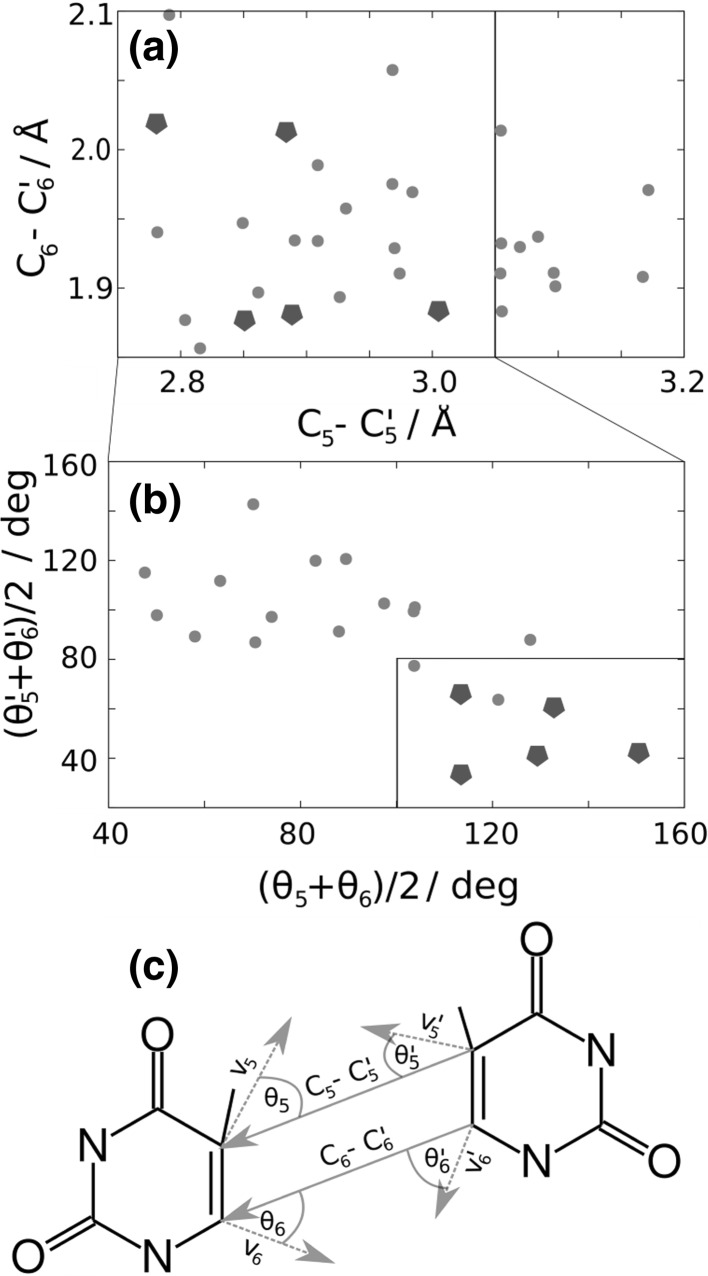
Fig. 7.
a C5–C5′ and C6–C6′ distances, b average angles formed between the distances C5–C5′ and C6–C6′ and the velocities at the atoms C5 and C6 at the moment of the 3BR→S 0 transition for 32 trajectories. c Definition of distances and angles employed in the analysis. The lines across a–c indicate that the next panel is a subset of the data points marked in the box of the previous panel. The green pentagons indicate trajectories undergoing dimerization (color figure online)

