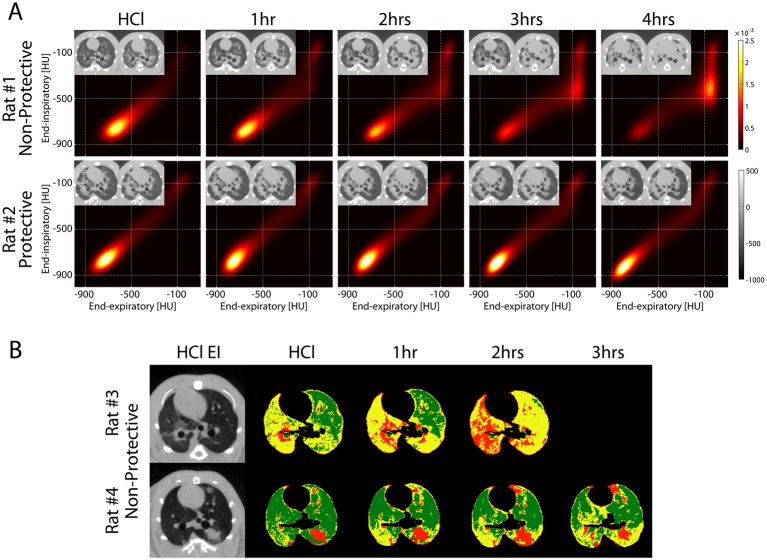
Figure 3.
(A) PRM obtained at baseline after HCl aspiration and hourly until the end of the experiment in two rats ventilated with non-protective ventilation (top: VT 12 mL/kg, PEEP 5 cmH2O) versus protective ventilation (bottom: VT 6 mL/kg, PEEP 10 cmH2O). The corresponding EI and warped EE images are shown in the inserts for each PRM and show more severe propagation in the animal with non-protective ventilation versus more contained injury in the rat with protective ventilation settings. In the rat with more propagation (top), the distribution of paired EI and EE density values in the PRM evolved over time, with increased fraction of voxels in the high EI and EE density range (>−300 HU), indicating oedema and/or non-reversible atelectasis (severe injury). In the rat with less propagation, voxel distributions were more stable over time. (B) Voxels that fell in the high-risk (yellow) and in the severe injury (red) domains of the PRMs were plotted in the corresponding EI images for each time point of the experiment in two rats, both ventilated with non-protective ventilation. Areas in green indicate voxels that fell in all remaining areas of the PRM. The inserts show the original baseline (after HCl) EI images. Severely injured regions progressively replaced the regions at risk. The rat with more propagation had a larger fraction of high-risk tissue at baseline and died before the 3-hour time point. EE, end-expiratory; EI, end-inspiratory; HCl, hydrochloric acid; PEEP, positive end-expiratory pressure; PRM, parametric response map; VT, tidal volume.

