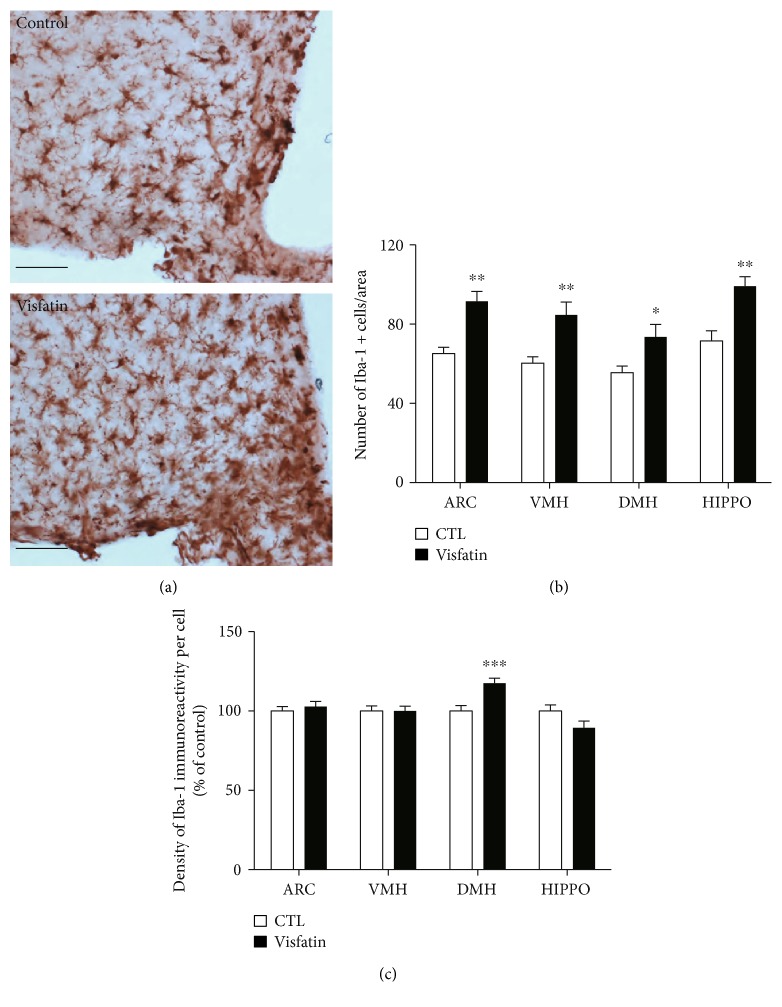
Figure 3.
Visfatin induces changes in the number of microglial cells and the intensity of Iba-1 protein signals in the hypothalamus. (a) Representative images showing immunostaining of Iba-1 in the hypothalamic arcuate nucleus. Scale bar = 100 μm. (b) Number of microglial cells and (c) intensity of Iba-1 signals observed in the hypothalamic areas (ARC, VMH, and DMH) and hippocampal CA1 (HIPPO) of mice following icv injection of visfatin compared to those in vehicle-injected mice. n = 5 for control (CTL) and n = 5 for visfatin. Results are presented as mean ± SEM. ∗P < 0.05, ∗∗P < 0.01, and ∗∗∗P < 0.005.

