
Figure 3.
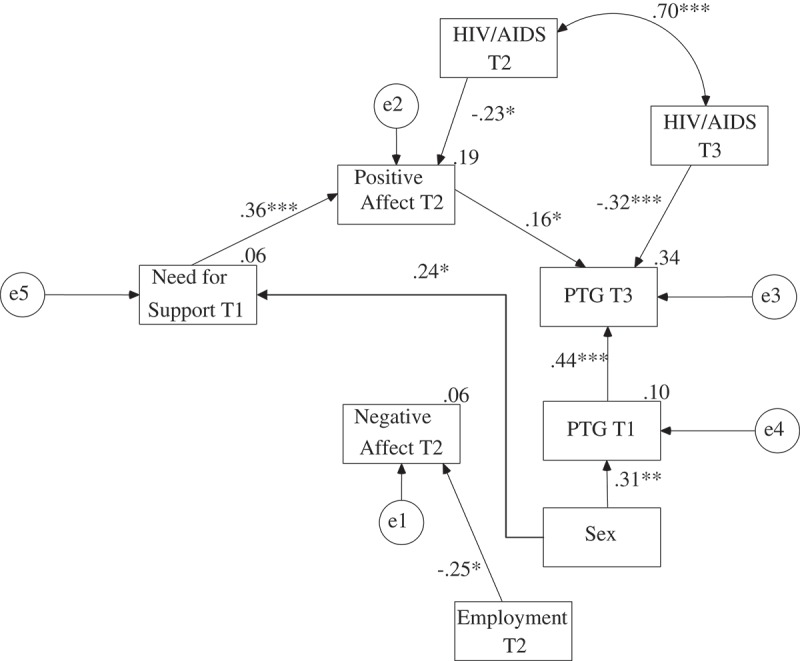
The final model of the relationship between PTG and need for support, positive and negative affect with regression coefficients.
Note. T1 = First Assessment; T2 = Second Assessment; T3 = Third Assessment.*p < .05; **p < .01; ***p < .001.
Official websites use .gov
A
.gov website belongs to an official
government organization in the United States.
Secure .gov websites use HTTPS
A lock (
) or https:// means you've safely
connected to the .gov website. Share sensitive
information only on official, secure websites.
The final model of the relationship between PTG and need for support, positive and negative affect with regression coefficients.
Note. T1 = First Assessment; T2 = Second Assessment; T3 = Third Assessment.*p < .05; **p < .01; ***p < .001.