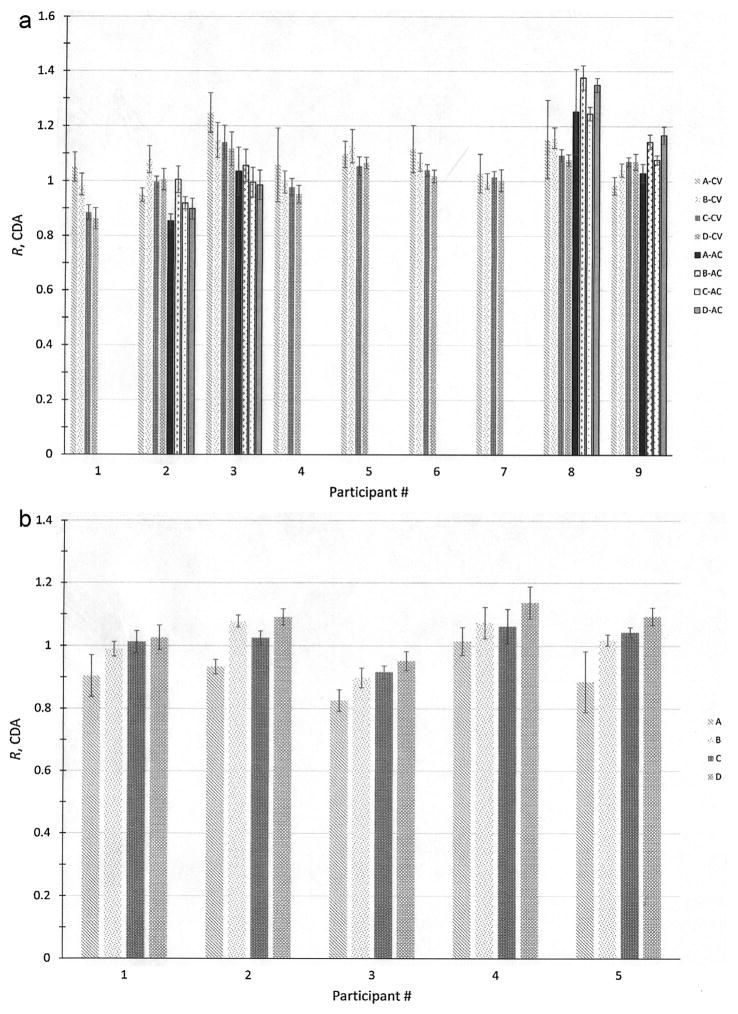
Fig. 5.
(a) Plot of ratios, R, of participants’ reported activities using planar imaging with Conjugate View (CV) and Attenuation Correction (AC) to the NIST-calibrated activity for the 4 sets (A through D) of 133Ba sources from the CDA. The uncertainty bars correspond to standard uncertainties and were calculated from the quadratic combination of the relative standard uncertainty on the NIST calibration for the respective source and the relative standard deviation on 3 repeated activity determinations of each source. (b) Plot of ratios, R, of activities from the CDA with CTAC to the NIST-calibrated activity for the 4 sets (A through D) of 133Ba sources. The uncertainty bars correspond to standard uncertainties and were calculated from the quadratic combination of the relative standard uncertainty on the NIST calibration for the respective source and the relative standard deviation on 3 repeated activity determinations of each source.

